


















AssetsAnalyzer
What is AssetsAnalyzer?
Finding reliable investment data often means switching between multiple platforms, comparing scattered reports, and spending valuable time verifying information. This platform brings everything together in one intuitive workspace, making stock and ETF research easier for both beginners and experienced investors. With over 20 years of historical market data, detailed financial reports, dividend analysis, analyst ratings, and comprehensive performance metrics, it provides a practical way to evaluate investment opportunities without unnecessary complexity.
Instead of overwhelming users with endless numbers, the platform organizes financial information into clear charts, comparison tools, and actionable insights. Whether someone is researching long-term dividend investments, evaluating growth companies, or comparing ETFs, the experience feels smooth, organized, and focused on helping users understand the market with confidence.
Key Features
User Interface
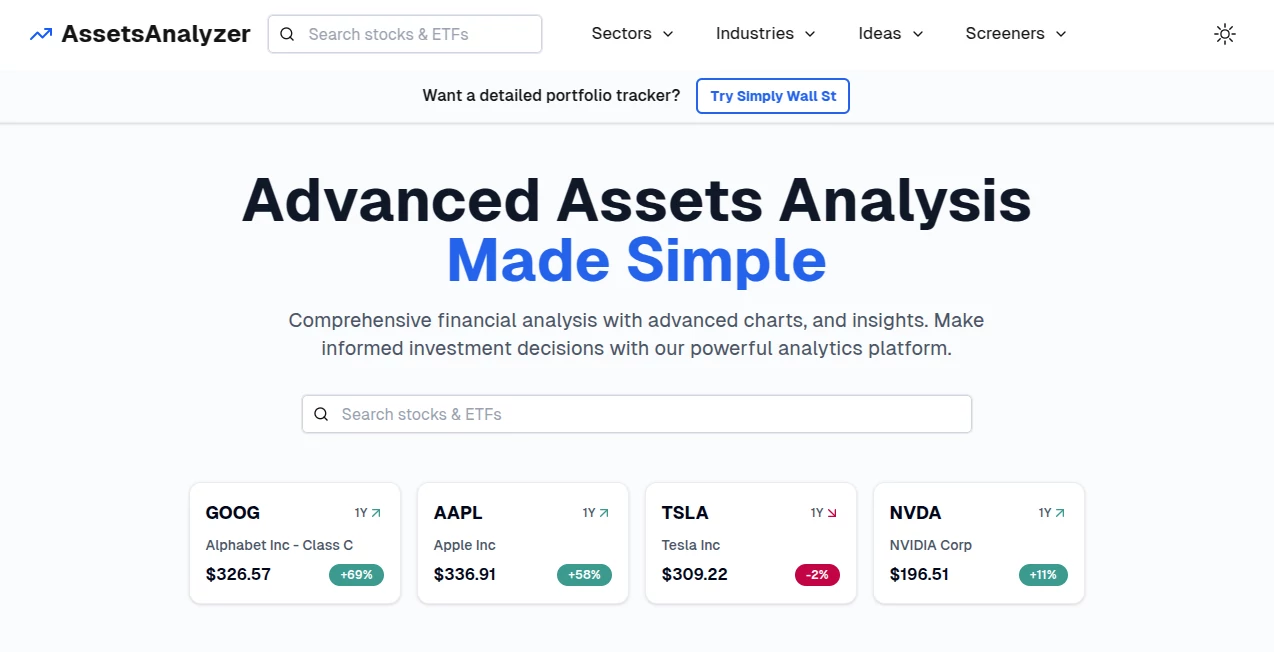
The interface is clean, responsive, and designed around fast navigation. Searching for a stock or ETF takes only a few seconds, while interactive charts, financial statements, and historical performance are presented in a logical layout. Even users with limited investing experience can quickly find the information they need without feeling overwhelmed.
Accuracy & Performance
The platform provides more than two decades of historical data covering thousands of stocks and ETFs. Investors can review annual and quarterly financial reports, analyst price targets, dividend history, inflation-adjusted returns, and numerous financial ratios. Performance comparisons against major benchmarks help users better understand historical trends before making investment decisions.
Capabilities
- Analyze more than 8,000 stocks and 5,000 ETFs.
- Access over 20 years of historical market data.
- Review annual and quarterly financial reports.
- Compare investments against market benchmarks.
- Explore analyst ratings and price targets.
- Study dividend history and yield performance.
- Evaluate valuation ratios including P/E, PEG, P/B, and P/S.
- Analyze drawdowns and historical risk.
- Discover ETFs containing specific stocks.
- Use advanced stock and ETF screeners with multiple filtering options.
- Analyze correlations between different investments.
- Export analysis data for further research.
Security & Privacy
The service is web-based and accessible without creating an account, allowing visitors to explore financial information quickly. Since the platform focuses on investment research rather than portfolio management, users can analyze market data without connecting brokerage accounts or sharing sensitive financial credentials.
Use Cases
- Research stocks before investing.
- Compare ETFs based on holdings and sector allocation.
- Evaluate dividend-paying companies.
- Analyze historical drawdowns and investment risks.
- Compare financial ratios across industries.
- Identify similar ETFs for diversification.
- Study long-term market performance.
- Support educational financial research.
Pros and Cons
- Pros
- Free access without registration.
- Extensive historical financial data.
- Powerful ETF and stock comparison tools.
- Comprehensive financial ratios and reports.
- Simple and user-friendly interface.
- Excellent visualization through interactive charts.
- Cons
- Focused primarily on stocks and ETFs.
- Designed for research rather than portfolio execution.
- Does not provide personalized investment advice.
Pricing Plans
The platform is available free of charge. Users can access financial reports, stock analysis, ETF research, screeners, historical data, and comparison tools without creating an account or paying subscription fees.
How to Use AssetsAnalyzer
- Open the website.
- Search for a stock ticker or ETF.
- Review historical performance charts.
- Analyze financial reports and valuation ratios.
- Compare assets with market benchmarks.
- Explore dividends, analyst ratings, and risk metrics.
- Use stock or ETF screeners to discover new opportunities.
- Apply the insights to support your investment research.
Comparison with Similar Tools
Unlike many investment research platforms that restrict important analytics behind premium subscriptions, this solution offers a generous collection of financial data without requiring sign-up. Historical performance analysis, drawdown reports, analyst ratings, ETF composition, valuation metrics, and correlation analysis are available in one place, reducing the need to switch between multiple websites. Its combination of accessibility, comprehensive datasets, and straightforward presentation makes it especially appealing for investors who value efficient research.
Conclusion
Reliable investment decisions begin with reliable information. By combining extensive historical market data, advanced financial metrics, intuitive visualization, and comprehensive stock and ETF analysis, this platform delivers a practical research environment for investors at every experience level. The ability to explore companies, compare ETFs, analyze risk, and study financial fundamentals without registration or subscription barriers makes it an impressive resource for anyone who wants deeper market insights while keeping the research process simple and efficient.
Frequently Asked Questions (FAQ)
Is the platform free to use?
Yes. All core research features are available without payment or registration.
Can beginners use this platform?
Yes. The organized interface makes financial information easy to explore, even for new investors.
Does it support ETF research?
Yes. Users can analyze ETF holdings, sector allocation, financial ratios, and compare similar funds.
Can I compare multiple investments?
Yes. The platform provides comparison tools for stocks, ETFs, financial ratios, and historical performance.
Does it provide investment advice?
No. The platform is intended for educational and research purposes, allowing users to make their own informed investment decisions.
AI Research Tool , AI Trading Bot Assistant , AI Investing Assistant , AI Analytics Assistant .
These classifications represent its core capabilities and areas of application. For related tools, explore the linked categories above.

AssetsAnalyzer Alternatives Product

Geoleaper

Sourcetable

Toflow AI

Candidate Sc…

Lessie AI

StatMate

Schema Synth

Grow A Garde…

AISEOMate
