





Langfuse
What is Langfuse?
Building an AI application is one thing; knowing exactly why it behaves the way it does in production is another. Langfuse is an open-source AI engineering platform designed to give developers a clearer view of what happens inside LLM applications and AI agents. It brings tracing, evaluations, prompt management, experiments, datasets, human feedback, and performance monitoring into one connected workflow.
Instead of jumping between application logs, spreadsheets, evaluation scripts, and separate monitoring systems, development teams can use a single environment to investigate AI behavior and improve it over time. The platform is designed for both early prototypes and production systems, making it particularly useful when an AI application starts receiving real users and real-world traffic.
A practical example is a customer-support assistant that suddenly starts producing slower or less useful answers. Rather than guessing whether the problem comes from the model, prompt, retrieval step, or tool call, developers can inspect the execution trace, review costs and latency, evaluate the output, and test a better version.
Key Features
- LLM Observability: Capture hierarchical traces covering model calls, tool invocations, retrieval steps, sessions, users, costs, latency, and other metadata.
- Prompt Management: Version, test, deploy, and roll back prompts without tying every prompt change to a code deployment.
- AI Evaluation: Evaluate outputs using LLM-as-a-judge methods, custom evaluators, human reviews, user feedback, and other scoring approaches.
- Datasets and Experiments: Build datasets from application data and use them to compare prompts, models, configurations, and code changes.
- Playground: Test prompts and compare model responses before pushing changes into production.
- Cost and Latency Tracking: Monitor token usage, model costs, response latency, and quality signals through dashboards and metrics.
- Human Annotation: Give teams a structured way to review traces and turn useful production examples into higher-quality datasets.
- OpenTelemetry Support: Work with OpenTelemetry instrumentation and a broad collection of languages, frameworks, and model providers.
User Interface
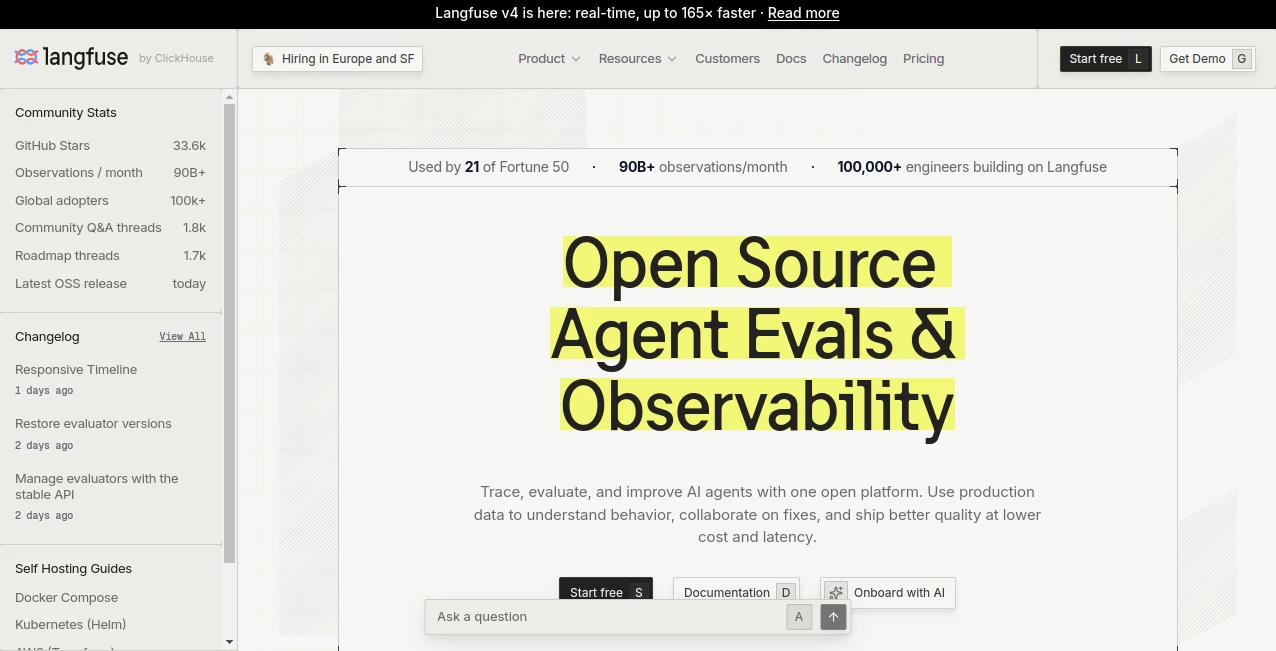
The interface is built around the workflow developers actually follow when troubleshooting an AI application. Traces, prompts, evaluations, datasets, experiments, and metrics are organized into separate areas while remaining connected to each other.
For example, a developer can move from a problematic generation to the prompt responsible for it, inspect its evaluation results, and compare another version without rebuilding the entire investigation from scratch. The playground and dashboards also make the platform useful for experimentation rather than simply passive logging.
The overall experience is technical, but it is focused on practical engineering work. Developers who already work with APIs, SDKs, traces, and model providers should find the environment relatively straightforward.
Accuracy & Performance
Accuracy monitoring is one of the platform's strongest areas because it does not treat an AI response as simply successful or unsuccessful. Teams can attach custom scores, use automated evaluation methods, collect human feedback, and compare results across prompts or models.
This is especially valuable for applications where traditional application monitoring is not enough. A request can return an HTTP 200 response while still producing a poor answer. By combining traces with evaluation data, teams can look beyond technical availability and measure whether the AI system is actually behaving as expected.
Performance monitoring also covers important operational signals such as latency and token usage. The platform is designed to process large volumes of AI observations, with the company reporting more than 90 billion observations processed per month and support for production deployments at significant scale.
Capabilities
The platform covers much more than basic logging. Developers can trace AI agents, monitor conversations and sessions, track users, inspect model costs, manage prompts, create evaluation datasets, run experiments, and analyze production behavior.
It supports Python and JavaScript SDKs as well as OpenTelemetry-based instrumentation for additional languages. Integrations include popular agent frameworks, model providers, AI development platforms, and tooling such as LangChain, LiteLLM, Vercel AI SDK, CrewAI, OpenAI, Anthropic, Google Gemini, Amazon Bedrock, and many others.
Another advantage is flexibility. The platform is available as a managed cloud service, while its open-source edition can be self-hosted using deployment options such as Docker Compose, Kubernetes, AWS, GCP, and Azure.
Security & Privacy
Security becomes particularly important when an observability platform receives prompts, model responses, user information, and application metadata. The platform provides data-region options and enterprise security capabilities designed for organizations with stricter requirements.
Its current security offering includes SOC 2 Type II and ISO 27001 reporting, GDPR support, EU and US data regions, and a HIPAA-ready region. Enterprise capabilities also include features such as SSO, role-based access controls, audit logs, SCIM, data retention management, and additional administration controls.
For organizations that prefer direct control over their infrastructure, the open-source edition provides another option: core platform functionality can be self-hosted under the MIT license.
Use Cases
- AI Agents: Trace multi-step agent workflows and identify where an agent makes an incorrect decision or encounters a failed tool call.
- RAG Applications: Inspect retrieval steps alongside model generations to investigate why an application may provide incomplete or inaccurate answers.
- Customer Support AI: Monitor conversations, latency, costs, and response quality while collecting feedback from users and reviewers.
- Prompt Engineering: Version prompts, test alternatives, compare results, and safely release improved versions.
- AI Product Monitoring: Understand how an AI feature behaves after deployment instead of relying only on traditional server logs.
- Model Evaluation: Compare different models and configurations against consistent datasets and evaluation criteria.
- Development and QA: Create regression datasets and test changes before they reach production.
- Cost Optimization: Track token consumption and model spending to find expensive workflows and opportunities for optimization.
Pros and Cons
Pros
- Open-source and available for self-hosting.
- Combines tracing, evaluations, prompt management, datasets, and experiments in one platform.
- Strong support for OpenTelemetry and modern AI development stacks.
- Useful for both prototypes and production-scale AI applications.
- Detailed cost, latency, and quality monitoring.
- Supports human feedback and annotation workflows.
- Works with a broad range of languages, frameworks, and model providers.
- A free cloud plan is available for smaller projects and proof-of-concept work.
Cons
- The number of features can feel overwhelming for developers who only need basic request logging.
- Setting up a complete evaluation and observability workflow requires some initial configuration.
- Teams with very large workloads may need to move to a higher paid tier as usage grows.
- Self-hosting provides greater control but also introduces infrastructure and maintenance responsibilities.
Pricing Plans
The pricing structure is designed to accommodate everything from small experiments to large production deployments. The Hobby plan is free and includes 50,000 units per month, 30 days of data access, and support through the community.
The Core plan starts at $29 per month and includes 100,000 units per month, 90 days of data access, unlimited users, and in-app support. Additional usage is billed according to the platform's usage-based pricing model.
The Pro plan costs $199 per month and is aimed at scaling projects. It includes 100,000 units per month, three years of historical data, higher rate limits, additional data-management capabilities, and advanced security and support features.
For larger organizations, the Enterprise plan starts at $2,499 per month and adds enterprise-focused capabilities such as audit logs, SCIM, custom rate limits, service-level agreements, and dedicated support. Pricing and features can change, so teams should review the current plan details before making a purchasing decision.
How to Use It
- Step 1: Create a cloud account or choose the self-hosted deployment option if your organization needs infrastructure-level control.
- Step 2: Create a project for the AI application you want to monitor.
- Step 3: Add tracing through the available SDKs, OpenTelemetry instrumentation, or supported integrations.
- Step 4: Send application traces containing model calls, prompts, responses, retrieval operations, tool calls, and relevant metadata.
- Step 5: Explore traces to identify errors, unexpected behavior, slow operations, and expensive requests.
- Step 6: Move important prompts into centralized prompt management and create versions that can be tested and compared.
- Step 7: Create datasets and evaluation criteria for recurring tests.
- Step 8: Run experiments against different prompts, models, or configurations and compare their results.
- Step 9: Monitor the production application using dashboards, evaluations, user feedback, cost information, and latency data.
Comparison with Similar Tools
AI observability has become a broader category, and several products can cover parts of the same workflow. Traditional application-monitoring platforms are often stronger when the main goal is infrastructure and general application performance monitoring. Dedicated AI engineering platforms, on the other hand, tend to provide deeper visibility into prompts, model generations, evaluations, and agent workflows.
The main advantage here is the combination of these AI-specific functions in one open platform. A team can inspect a production trace, connect it to the prompt that generated the response, evaluate the output, create a dataset from real examples, and test an improved version as part of one workflow.
It also stands apart from closed observability products through its open-source approach and self-hosting options. For teams that care about data portability, infrastructure control, and avoiding unnecessary vendor lock-in, that distinction can be important.
For a company already heavily invested in a general observability ecosystem, using both systems can also make sense. General infrastructure monitoring can cover servers and application health, while an AI-focused platform handles the deeper evaluation and LLM-specific development workflow.
Conclusion
For teams building serious LLM applications, visibility becomes increasingly important as soon as a prototype turns into a real product. A response that looks fine during development can behave very differently once thousands of real requests begin flowing through the system.
This platform addresses that problem by connecting observability with the rest of the AI engineering process. Developers can trace what happened, measure the result, inspect the prompt, compare alternatives, collect human feedback, and continuously test improvements.
The combination of an open-source foundation, self-hosting support, broad integrations, evaluation capabilities, and production monitoring makes it a particularly compelling option for engineering teams that want more control over their AI stack. It is not simply a log viewer; it is designed to become part of the ongoing process of building, debugging, evaluating, and improving AI applications.
Frequently Asked Questions (FAQ)
What is this platform mainly used for?
It is primarily used for AI observability, LLM tracing, prompt management, evaluation, experimentation, and monitoring the behavior, cost, and performance of AI applications and agents.
Is it open source?
Yes. The core platform is open source and released under the MIT license. Teams can self-host it and retain greater control over their infrastructure and data.
Does it support AI agents?
Yes. It can capture hierarchical traces for agent workflows, including model calls, tool invocations, retrieval operations, and other steps involved in an agent's execution.
Can developers evaluate AI responses?
Yes. Evaluation can involve LLM-as-a-judge methods, custom scores, human annotation, user feedback, datasets, and experiments.
Does it support prompt versioning?
Yes. Prompts can be centrally managed, versioned, tested, deployed, and rolled back, helping teams separate prompt changes from application code releases.
Is there a free plan?
Yes. The Hobby plan is available at no cost and currently includes 50,000 units per month, 30 days of data access, and community support.
Can it be self-hosted?
Yes. Self-hosting is supported through deployment options including Docker Compose, Kubernetes, AWS, GCP, and Azure.
Which programming languages and frameworks are supported?
Native SDKs are available for Python and JavaScript, while OpenTelemetry support extends instrumentation to languages such as Go, Java, .NET, Ruby, PHP, and Swift. The platform also integrates with many popular AI frameworks and model providers.
Is it suitable for production applications?
Yes. The platform is designed to operate from early prototypes through production workloads and provides features for tracing, evaluation, monitoring, security, collaboration, and cost management.
Can it help reduce AI costs?
Yes. Token usage, model costs, and latency can be monitored so teams can identify expensive workflows and investigate whether different prompts, models, or application designs could deliver similar results more efficiently.
AI Testing & QA , Large Language Models (LLMs) , AI Analytics Assistant , AI Developer Tools .
These classifications represent its core capabilities and areas of application. For related tools, explore the linked categories above.

Langfuse Alternatives Product

gemini omni …

AiDisco
Devplan

X Growth Eng…

AIQualityHQ

DemoDash

Lovable APP

ModelsLab

Quso AI