


















Simple Analytics
What is Simple Analytics?
Website analytics can tell you a lot, but finding the right answer is not always as simple as looking at a dashboard. A marketer may want to know why traffic changed last week. A founder may want to compare visitors from different countries. A content team might simply want to know which pages are attracting the most attention.
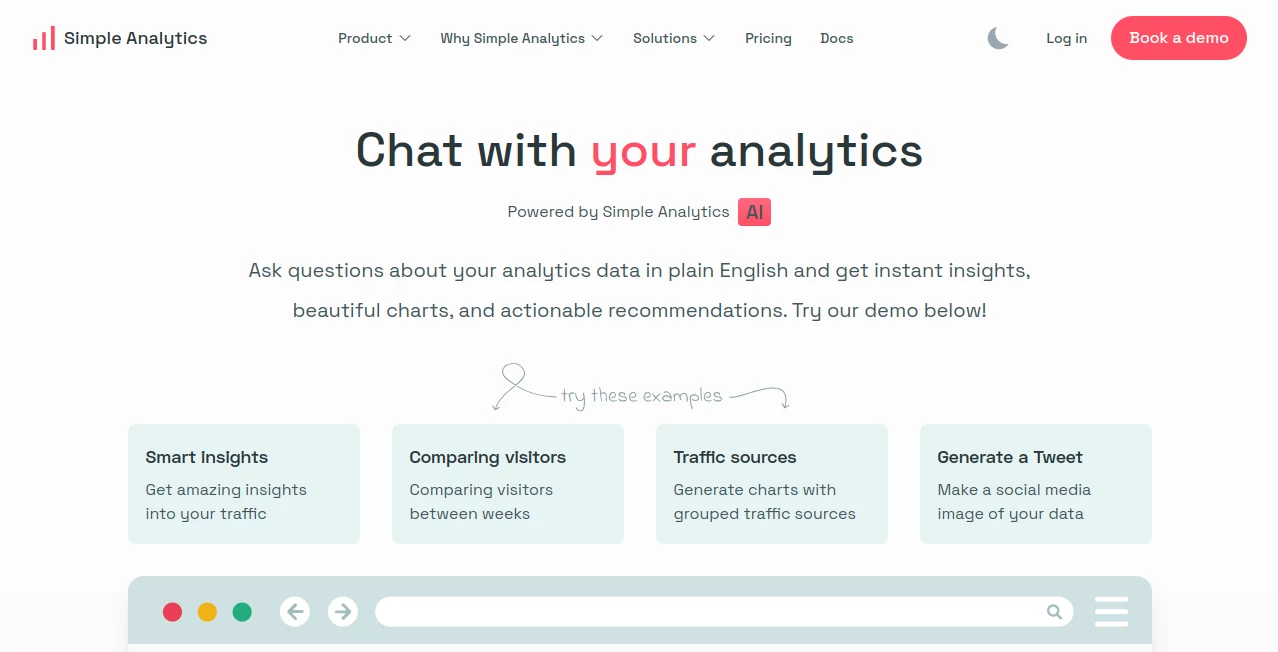
Simple Analytics brings an AI-powered way of exploring this information into the analytics experience. Instead of manually opening filters and moving between different reports, users can ask questions about their website data in plain English and receive insights, charts, and recommendations in response.
The approach is particularly appealing to teams that want useful website analytics without turning visitor tracking into a complicated process. The platform is built around privacy-friendly analytics, with no cookies, no personal data collection, and EU-hosted data.
Key Features
- Ask questions about website analytics using natural language.
- Get instant insights from traffic data.
- Compare visitor numbers across different periods.
- Generate charts based on traffic sources and other analytics dimensions.
- Turn analytics data into social media-ready content.
- Explore traffic information without relying on complex dashboard navigation.
- Use analytics data through APIs and exports when deeper analysis is required.
User Interface
The interface takes a conversational approach to analytics. Rather than expecting every user to understand advanced reporting terminology, it allows questions to be written in ordinary language.
This makes the experience especially useful for people who understand their business well but do not want to spend time learning every detail of an analytics platform. A question about visitors, traffic sources, or changes between two periods can be entered directly and the system can turn that request into an understandable result.
The visual side is useful too. When a question benefits from a chart, the AI experience can present the information visually instead of leaving the user with a wall of numbers.
Accuracy & Performance
The quality of an analytics assistant ultimately depends on the underlying data. This solution benefits from being connected directly to website analytics rather than asking users to manually prepare datasets before asking questions.
Its natural-language approach can also reduce the chance of overlooking a useful filter. Instead of remembering where a particular metric is located, users can describe what they want to investigate and let the analytics assistant interpret the request.
For example, someone investigating a sudden traffic change can compare visitor numbers between weeks, examine traffic sources, and look for patterns without manually building every report from scratch.
Capabilities
The AI functionality is designed around practical analytics questions rather than generic chatbot conversations. Users can investigate their traffic, compare visitors between time periods, group traffic sources into charts, and turn selected data into social media content.
The wider analytics platform adds capabilities such as event tracking, goals, funnels, filters, email reports, embedded charts, exports, and API access. This creates a useful combination: the AI layer makes exploration easier, while the underlying analytics infrastructure remains available when a more detailed investigation is needed.
Developers and data-focused teams can also access analytics through APIs, including aggregated statistics and raw data exports. Filters can be applied to dimensions such as pages, countries, referrers, UTM parameters, browsers, and devices.
Security & Privacy
Privacy is one of the strongest aspects of the platform. The analytics service does not use cookies and does not collect or store IP addresses, visitor IDs, personal profiles, or cross-site identifiers.
Website data is hosted in the European Union, with the company stating that data stays in the Netherlands. This makes the service particularly attractive to organizations that need to take privacy and European data protection requirements seriously.
For businesses that are tired of adding another consent-dependent tracking system to their website, the privacy-first architecture can be a major advantage. The goal is to understand website traffic without turning analytics into a mechanism for identifying individual visitors.
Use Cases
For marketing teams, the AI assistant can make everyday traffic research considerably quicker. Instead of manually checking several reports, a marketer can ask which sources brought visitors during a particular period and then investigate the results.
Content teams can use the analytics experience to understand which pages receive attention and compare traffic patterns over time. This can help when deciding which subjects deserve more content or which existing pages need improvement.
Startup founders can benefit from the simplicity. When time is limited, being able to ask a direct question about website performance is often more useful than spending several minutes configuring a report.
Agencies can also use the broader reporting and sharing capabilities to prepare information for clients. Meanwhile, developers can take advantage of the API and export functionality when analytics data needs to flow into another system.
A practical example would be a SaaS company that notices a drop in traffic. Instead of immediately assuming that search performance has declined, the team could compare visitors across weeks, examine referral sources, inspect affected pages, and use the results to determine where the change actually occurred.
Pros and Cons
- Pros: Natural-language analytics makes data exploration easier.
- Pros: Generates useful charts from analytics questions.
- Pros: Strong privacy-first approach with no cookies or personal visitor tracking.
- Pros: EU-hosted data is useful for privacy-conscious organizations.
- Pros: API and export options provide flexibility for technical teams.
- Pros: Works alongside a broader analytics platform with events, goals, funnels, filters, and reports.
- Cons: Users looking for extremely granular individual-user tracking may find the privacy-first approach intentionally limiting.
- Cons: The AI experience is most valuable when meaningful website analytics data is already available.
Pricing Plans
The service offers a free plan alongside paid options. The current self-serve pricing starts at £20 per month for up to 100,000 monthly pageviews when billed monthly, with annual billing offering two months free. Pricing is based around website usage rather than charging every individual visitor separately.
The free option is designed for hobby sites and includes one user and up to five websites, with a limited analytics history. New users can also start with a 14-day trial without providing a credit card.
For larger organizations, an enterprise offering provides additional capabilities such as single sign-on, role-based access, enterprise support, data access, and integrations with existing analytics and business intelligence workflows.
How to Use This Tool
Start by connecting the analytics service to your website and allowing it to collect your website traffic data. Once data is available, open the AI analytics experience and type a question in plain English.
There is no need to phrase the request like a database query. Ask the question as you would ask a colleague. For example, you could investigate visitor changes between two weeks, explore traffic sources, or ask about visitors from a particular country.
Review the answer and any generated visualization. If the result raises another question, continue the conversation rather than rebuilding the report manually. For deeper work, use the standard dashboard, filters, exports, or API access to examine the underlying data in more detail.
Comparison with Similar Tools
Traditional analytics platforms can provide an enormous amount of information, but that depth can come with a steeper learning curve. Users often need to know which report to open, which dimension to select, and which filters to apply before they can answer a relatively simple question.
The conversational approach takes a different route. It puts the question first and the reporting mechanics second. That can make it a better fit for founders, marketers, content teams, and other users who need answers more often than they need to build complex dashboards.
Privacy is another important distinction. Many mainstream analytics products are designed around cookies, identifiers, advertising ecosystems, or detailed user-level tracking. Here, the philosophy is almost the opposite: collect useful aggregate analytics while avoiding personal visitor tracking.
For teams that need extremely detailed user profiling, this may not be the right direction. For organizations that want reliable website traffic information while keeping visitor privacy at the center, the trade-off is much more attractive.
Conclusion
AI becomes genuinely useful in analytics when it removes friction rather than simply adding another layer of technology. This approach does exactly that by letting users interact with website data through ordinary questions and receive understandable insights and visualizations.
The combination of conversational analytics, practical reporting features, API access, and a strong privacy-first philosophy makes it an interesting option for modern websites. It is particularly compelling for teams that want to understand what is happening on their websites without becoming dependent on complicated dashboards or invasive visitor tracking.
For someone who has ever opened an analytics dashboard and thought, “I know the answer is somewhere in here, but where?”, a conversational interface can be a refreshing change.
Frequently Asked Questions (FAQ)
What can I ask the AI about my website?
You can ask questions about your website analytics, including visitor comparisons, traffic sources, and changes across different periods. The system can also generate visualizations from relevant data.
Does it use cookies?
No. The analytics platform is designed without cookies and does not rely on personal visitor tracking to provide website traffic insights.
Does it collect personal data?
The platform states that it does not collect personal data, IP addresses, visitor IDs, or cross-site identifiers. It focuses on non-personal website analytics.
Where is the data hosted?
The company states that website data is hosted in the Netherlands and remains within the European Union.
Can developers access the analytics data?
Yes. API access and export functionality are available for teams that want to query analytics, automate workflows, build dashboards, or move data into other systems.
Is there a free plan?
Yes. A free option is available for hobby websites, and new users can also start with a 14-day trial without a credit card.
Is this suitable for marketing teams?
Yes. Marketing teams can use conversational analytics to investigate traffic sources, compare performance over time, and turn useful analytics findings into content for other channels.
Is it suitable for privacy-conscious businesses?
Yes. Privacy is a central part of the product design, with no cookies, no personal visitor profiles, and EU-hosted data.
These classifications represent its core capabilities and areas of application. For related tools, explore the linked categories above.
Simple Analytics details
Website unavailable — View Alternatives
Pricing
- Freemium
Apps
- Web App
Categories

Simple Analytics Alternatives Product

IntoTheBlock

mainaro

LazyLister

CoinIQ

Pips Hint

Reachara

AICosts.ai

Arobis AI Vi…

AyeWatch AI