Better Stack
What is Better Stack?
Modern software systems are complex, distributed, and constantly evolving. Keeping them stable requires more than just basic monitoring—it demands real-time visibility, fast debugging, and reliable incident response.
This platform brings all of that together in one place. Instead of juggling multiple disconnected tools for logs, uptime monitoring, and alerts, teams get a single streamlined environment designed to reduce noise and surface what truly matters.
It is especially valuable for developers, DevOps engineers, and product teams who need to maintain system reliability without slowing down development speed. The experience feels lightweight, yet powerful enough to handle production-scale infrastructure.
Key Features
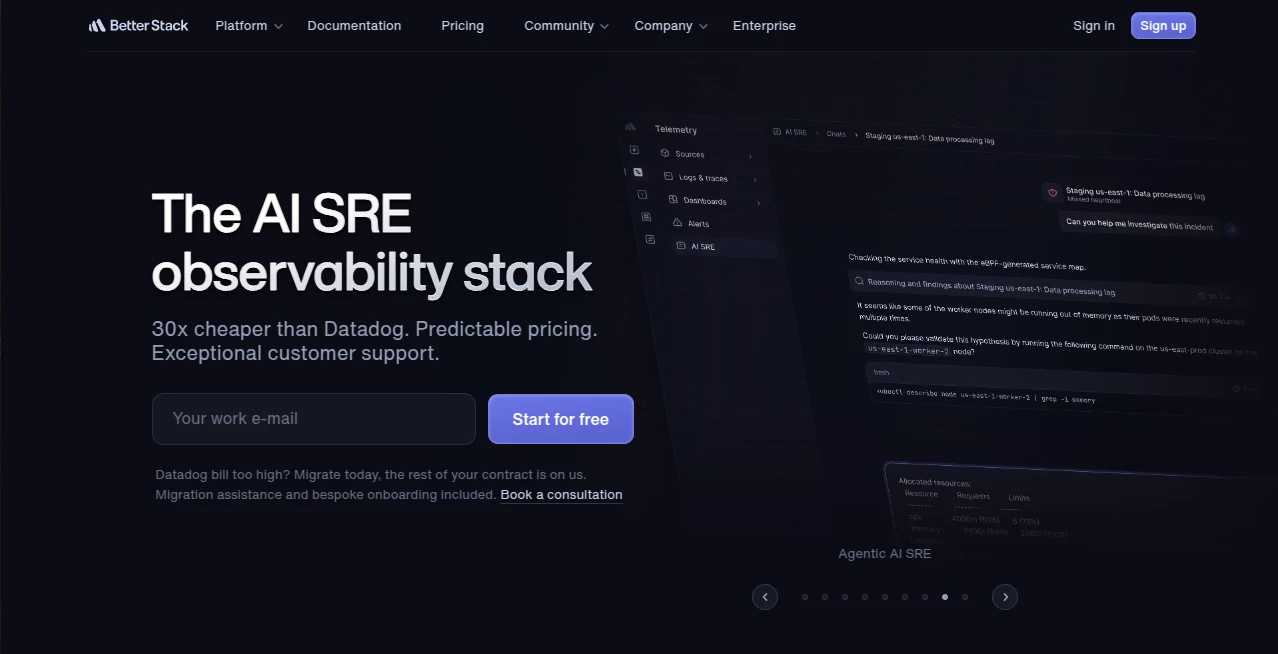
User Interface
The interface is clean, modern, and intentionally minimal. It avoids overwhelming users with unnecessary complexity, focusing instead on clarity and fast navigation between logs, metrics, and incidents.
Accuracy & Performance
Data is delivered in near real-time, allowing teams to detect issues before they escalate. Log aggregation and uptime tracking are optimized for speed, even under heavy system loads.
Capabilities
The platform combines multiple essential DevOps functions into one ecosystem. From log management to uptime checks and incident workflows, it helps teams stay ahead of outages and performance bottlenecks.
- Centralized log management with fast search
- Uptime and performance monitoring
- Incident detection and alerting workflows
- Status page creation for transparency
- Integrations with modern developer tools
Security & Privacy
Security is handled with a strong focus on data protection and access control. Logs and system data are encrypted, and role-based permissions ensure only authorized users can access sensitive information.
Use Cases
- Monitoring production applications in real time
- Debugging backend and infrastructure issues quickly
- Tracking uptime and service reliability for APIs
- Managing incident response across engineering teams
- Providing public status updates during outages
Pros and Cons
Pros:
- All-in-one observability solution
- Fast and intuitive search for logs
- Clean and developer-friendly interface
- Strong alerting and incident workflows
- Easy integration with modern tech stacks
Cons:
- Advanced features may require onboarding time
- Smaller teams may not use the full feature set
- Customization can be limited for very niche workflows
Pricing Plans
The platform typically offers flexible pricing tiers designed for individuals, startups, and enterprise teams. A free tier is usually available for small-scale projects, while paid plans unlock advanced monitoring, longer data retention, and team collaboration features.
How to Use the Platform
Getting started is straightforward. After creating an account, users connect their applications or servers to start collecting logs and metrics. From there, dashboards automatically populate with system data, and alerts can be configured based on specific conditions.
Teams can also set up uptime monitors and create status pages to keep users informed during incidents, improving transparency and trust.
Comparison with Similar Tools
Compared to traditional monitoring stacks that require multiple separate services, this platform simplifies everything into a unified experience. Instead of combining standalone log tools, uptime monitors, and incident systems, everything is handled within a single workflow.
This reduces integration overhead and helps teams respond faster when issues occur, especially in distributed systems where timing is critical.
Conclusion
For engineering teams that value reliability, speed, and simplicity, this platform delivers a balanced solution. It removes the friction of managing multiple observability tools and replaces it with a unified system that is both powerful and easy to operate.
It is a strong choice for teams that want better visibility into their infrastructure without adding unnecessary operational complexity.
Frequently Asked Questions (FAQ)
What is this platform used for?
It is used for monitoring applications, collecting logs, tracking uptime, and managing incidents in one unified system.
Is it suitable for small teams?
Yes, it works well for startups as well as large engineering organizations.
Does it support real-time monitoring?
Yes, data updates in near real-time to help teams respond quickly to issues.
Can it replace multiple DevOps tools?
In many cases, yes. It combines several observability and monitoring functions into one platform.
AI DevOps Assistant , AI Monitor & Report Builder , AI Log Management , AI Developer Tools .
These classifications represent its core capabilities and areas of application. For related tools, explore the linked categories above.

Better Stack Alternatives Product

GOLANG COLLE…

DeepSeek V4

Sound Level …
Project Mela
DiRe-RAPIDS
HostFinder
Devplan

volume shade…

AllInOneTools