


















Chartsy
What is Chartsy?
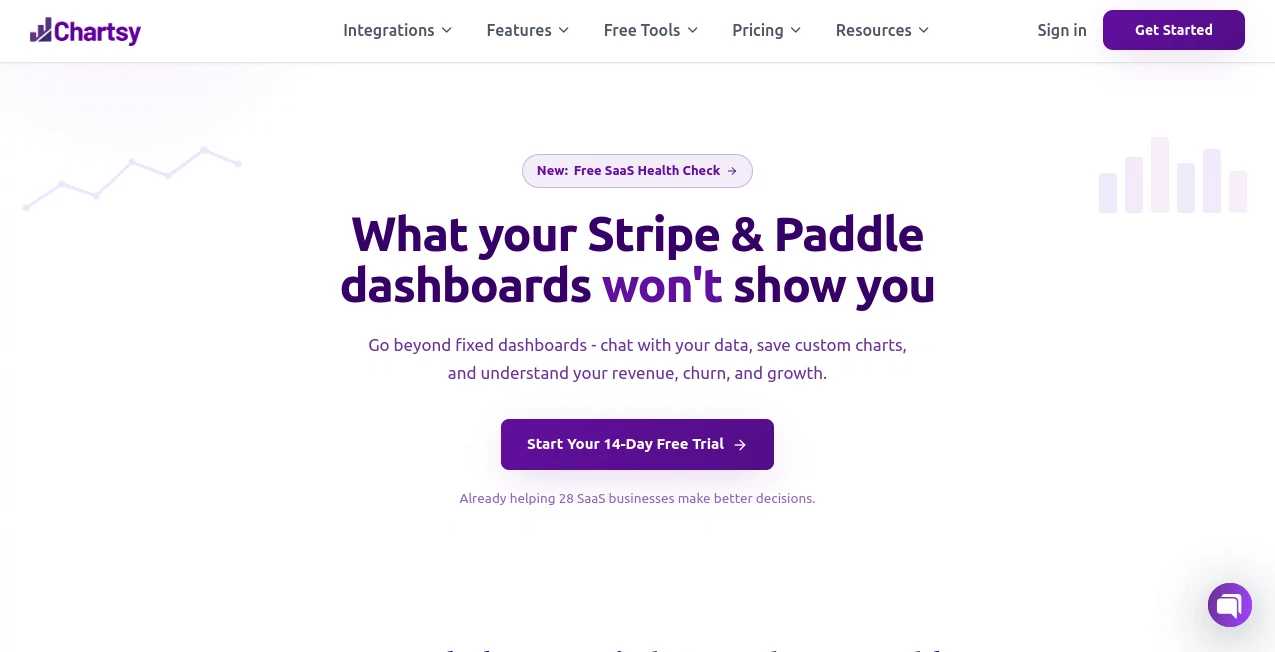
Understanding business data should never require hours of manual reporting or advanced technical skills. This platform transforms raw business information into meaningful visualizations by allowing users to ask questions in natural language instead of building complicated reports. Whether the goal is tracking subscription revenue, monitoring churn, or exploring customer behavior, the experience feels intuitive from the very first interaction.
Designed for SaaS companies, subscription businesses, and e-commerce teams, it connects directly with popular payment platforms and automatically generates charts, dashboards, and insights. Rather than navigating dozens of filters or exporting spreadsheets, users simply describe what they want to know and receive clear visual answers within seconds.
For founders, product managers, marketers, and financial teams, this creates a faster way to understand performance and make informed decisions without relying on SQL queries or dedicated data analysts.
Key Features
User Interface
The interface is intentionally simple and conversation-driven. Instead of traditional analytics dashboards filled with menus and filters, users type questions in everyday English. Interactive charts appear almost instantly and can be customized, renamed, saved to dashboards, downloaded as images, or exported for presentations. Ready-made dashboard templates also reduce setup time for new users.
Accuracy & Performance
The platform works directly with live business data from connected payment providers, allowing metrics such as Monthly Recurring Revenue (MRR), churn, customer lifetime value, subscriptions, refunds, and revenue trends to remain current. Automated calculations reduce manual reporting errors while providing reliable visual summaries for business decisions.
Capabilities
- Create charts by asking questions in plain English.
- Analyze subscription revenue and recurring income.
- Monitor customer churn and retention trends.
- Generate AI-powered dashboards in minutes.
- Connect directly with Stripe, Paddle, and BigCommerce.
- Export charts and reports for presentations.
- Save customized dashboards for continuous monitoring.
- Receive automated weekly business reports.
- Explore customer metadata and segmentation.
- Use conversational AI to understand business metrics.
Security & Privacy
Business information is synchronized through secure read-only connections, ensuring operational safety while preventing unintended data changes. Privacy-focused options, including GDPR-friendly synchronization, help organizations minimize stored personal information while still benefiting from AI-powered analysis. Documentation also explains how uploaded datasets are processed and protected during analysis.
Use Cases
- SaaS founders monitoring recurring revenue growth.
- Finance teams preparing investor reports.
- Subscription businesses tracking customer churn.
- E-commerce stores analyzing product performance.
- Marketing teams measuring revenue by campaign.
- Executives reviewing business performance through visual dashboards.
- Operations teams identifying revenue trends quickly.
- Startups replacing spreadsheet-based reporting workflows.
Pros and Cons
- Pros
- Very easy to use without technical knowledge.
- Natural language chart generation.
- Fast dashboard creation.
- Useful integrations for subscription businesses.
- Automated reports save valuable time.
- Clear visualizations suitable for presentations.
- Privacy-conscious architecture.
- Cons
- Primarily focused on SaaS and subscription analytics.
- Some advanced integrations may still be expanding.
- Organizations with highly customized data pipelines may require additional setup.
Pricing Plans
A free trial is available for new users, allowing businesses to explore the platform before choosing a paid subscription. Premium plans provide access to advanced analytics, dashboards, AI-powered reporting, and additional business intelligence capabilities.
How to Use Chartsy
Create an account and connect a supported payment provider or upload a compatible CSV dataset. Once the data has been synchronized, simply type questions such as revenue trends, customer growth, or churn analysis in natural language. The platform automatically selects appropriate visualizations, generates charts, and allows them to be saved, customized, or exported for future reporting.
Comparison with Similar Tools
Traditional analytics platforms often require SQL knowledge, manual dashboard creation, or extensive spreadsheet work before meaningful insights become available. This solution focuses on conversational analytics, enabling users to ask business questions directly without building reports from scratch. The AI-generated visualizations, automated dashboards, and business-oriented workflow make it particularly attractive for founders and growing SaaS companies looking for speed and simplicity.
Conclusion
For businesses that depend on recurring revenue, understanding financial performance quickly can make a significant difference. This solution removes much of the complexity associated with business intelligence by combining conversational AI, automated analytics, and clean visual dashboards into a single workflow. The result is a practical analytics assistant that helps organizations spend less time preparing reports and more time making confident decisions based on real data.
Frequently Asked Questions (FAQ)
Who is this platform designed for?
It is primarily built for SaaS businesses, subscription services, and e-commerce companies that need faster access to business insights.
Do I need SQL or technical knowledge?
No. Users simply ask questions in natural language and receive charts automatically.
Can reports be exported?
Yes. Charts and dashboards can be exported for presentations and business reporting.
Which business platforms are supported?
It supports integrations with Stripe, Paddle, and BigCommerce, along with CSV data analysis.
Is business data protected?
Yes. Secure read-only integrations and privacy-focused synchronization options help protect business information during analysis.
AI Charting , AI Research Tool , AI Business Ideas Generator , AI Analytics Assistant .
These classifications represent its core capabilities and areas of application. For related tools, explore the linked categories above.

Chartsy Alternatives Product

Diploria AI

ModelsLab

Arobis AI Vi…

DiRe-RAPIDS

CapyQR

Sourcetable

Zamicus

Grok 4

Creget
