


















PostHog
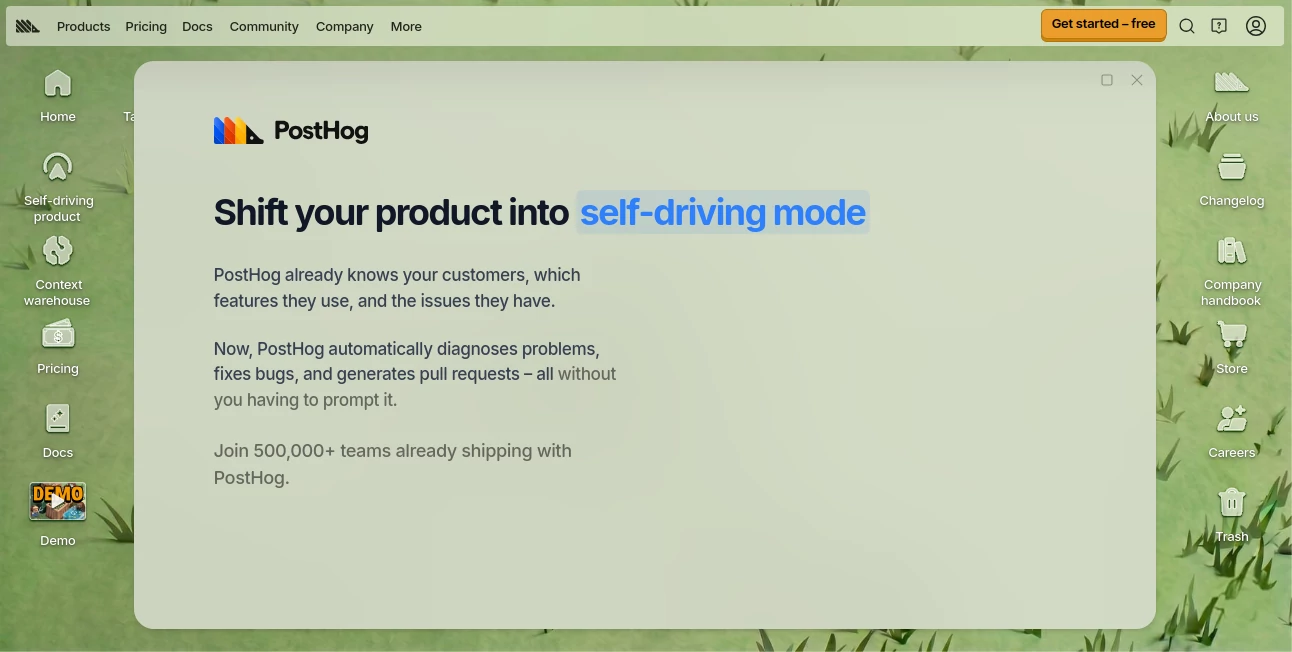
What is PostHog?
PostHog is a product analytics and developer-focused platform designed to help teams understand how people use their software and turn those insights into better products. Instead of stitching together separate services for analytics, session recordings, experiments, feature flags, surveys, error tracking, and data management, teams can bring many of these workflows together in one place.
What makes the platform particularly appealing to product engineers is its practical approach. It is built around real product data rather than vague business dashboards, giving teams the ability to investigate user behavior, identify friction, test ideas, and measure what happens after a change is released.
The platform has also expanded considerably beyond traditional product analytics. Its current product suite includes web analytics, session replay, feature flags, experiments, surveys, error tracking, a managed data warehouse, CDP capabilities, workflows, logs, AI observability, traces, heatmaps, and other developer-oriented tools.
Key Features
- Product analytics for tracking events, funnels, retention, paths, trends, and user behavior.
- Session replay for watching real user sessions and investigating confusing product experiences.
- Feature flags for controlled releases and gradual rollouts.
- Experimentation and A/B testing for measuring changes before committing to them broadly.
- Surveys for collecting direct feedback from users.
- Error tracking and logs for connecting product behavior with technical problems.
- Data warehouse capabilities for bringing product and external data together.
- AI-powered analysis and observability features designed to reduce repetitive investigation work.
- APIs, webhooks, integrations, and developer-focused tooling for technical teams.
User Interface
The interface is designed around investigation rather than simply displaying attractive charts. Teams can move between analytics, recordings, experiments, feature flags, and other parts of the product without constantly exporting information into another system.
This is especially useful when investigating a specific problem. For example, if an onboarding funnel suddenly loses users at one step, a product engineer can analyze the event data, inspect relevant sessions, check errors, and then test a potential fix. That connected workflow can save a surprising amount of time.
There is a learning curve because the platform offers a lot of functionality. However, developers and technically comfortable product teams are likely to appreciate the amount of control available once the core concepts become familiar.
Accuracy & Performance
Analytics are only useful when the underlying event data is reliable, and the platform puts considerable emphasis on collecting and querying detailed product activity. Teams can define events and properties, build analytical views, examine retention, investigate funnels, and work with data through SQL-oriented tooling.
Performance also benefits from having multiple investigation tools connected to the same product context. Rather than treating analytics, session recordings, errors, and experiments as unrelated datasets, teams can use them together to understand what is happening inside an application.
For a growing software product, this makes it easier to move from a broad question such as “Why did activation drop?” to a much more specific investigation involving particular users, events, sessions, errors, or releases.
Capabilities
The strongest aspect of the platform is the breadth of its capabilities. Product analytics can be combined with session replay, experimentation, feature management, surveys, error tracking, and data infrastructure.
Its data stack can also connect information from external services. The platform states that its context warehouse supports more than 120 sources and destinations, allowing teams to bring information from services such as Stripe, Postgres, and HubSpot into a broader product-data environment.
There is also a strong developer orientation. SDKs, APIs, webhooks, SQL tooling, and integrations make it suitable for teams that want analytics to become part of the development workflow rather than something maintained exclusively by a separate analytics department.
Security & Privacy
Security and compliance are important considerations for any platform handling customer and product usage data. The company's Trust Center states that its products are covered by a SOC 2 Type II report and lists compliance frameworks and standards including GDPR, CCPA, and HIPAA.
The platform also provides a dedicated security and compliance portal where customers can review security practices and access relevant documentation. Organizations should still evaluate their own data-processing requirements, retention policies, regional requirements, and configuration choices before sending sensitive information into any analytics system.
Use Cases
- Product analytics: Measure activation, retention, engagement, conversion funnels, and feature adoption.
- Startup product development: Give small engineering teams detailed visibility into how customers actually use a new product.
- User experience investigation: Combine behavioral analytics with session recordings to understand where users struggle.
- Feature launches: Release new functionality gradually with feature flags and monitor the results.
- A/B testing: Compare product variations and measure their impact using real usage data.
- Error investigation: Connect technical problems with the users and product journeys affected by them.
- Customer research: Use surveys and behavioral information together to understand what users need.
- Data-driven growth: Track activation and retention to identify which product changes actually improve the customer journey.
- AI-powered development: Use AI-oriented analysis and observability capabilities to investigate product and engineering data more efficiently.
Pros and Cons
Pros:
- Broad collection of product and developer tools in one platform.
- Strong focus on product engineers and technical teams.
- Generous free usage allowances across several products.
- Usage-based pricing can be attractive for startups and smaller teams.
- Powerful combination of analytics, session replay, experimentation, and feature flags.
- Strong API, integration, and data capabilities.
- Useful AI features for analyzing and working with product data.
- Transparent approach to pricing and product development.
Cons:
- The large number of features can feel overwhelming for first-time users.
- Teams with very simple analytics requirements may not need the entire product suite.
- Usage-based pricing requires monitoring event and product consumption as a company grows.
- Getting the most from advanced analytics requires some technical knowledge.
Pricing Plans
The pricing model is based primarily on usage rather than a traditional fixed subscription. The company provides separate free allowances for many of its products, which makes it possible for startups and smaller projects to begin without committing to a large monthly bill.
For example, the current published pricing includes a free allowance of 1 million product analytics events per month, 5,000 session recordings per month, 1 million feature flag requests per month, and 1 million rows per month for the managed warehouse. Paid usage is then calculated according to the specific product and volume, with rates decreasing as usage increases.
This approach is particularly interesting for early-stage teams because the cost can scale alongside actual usage. The company states that 98% of its customers use the platform for free, while paid products generally follow a pay-per-use model with monthly free tiers.
How to Use PostHog
- Create an account and start a new project.
- Install the appropriate SDK or integration for your application.
- Configure the events and properties you want to measure.
- Collect enough product activity to establish useful behavioral patterns.
- Create insights, funnels, retention reports, dashboards, or other analytical views.
- Use session recordings when quantitative data does not explain why users are behaving a certain way.
- Introduce feature flags when releasing or testing new functionality.
- Run experiments and compare results against meaningful product metrics.
- Use surveys to collect direct feedback from users.
- Connect additional data sources when you need a broader view of customer activity.
A practical starting point is to avoid tracking everything immediately. Pick a handful of important actions, such as account creation, onboarding completion, subscription activation, or a core product action. Once those events are reliable, expand the tracking setup based on the questions your team actually needs to answer.
Comparison with Similar Tools
Traditional analytics platforms often focus primarily on measuring website or product activity. Dedicated session-replay products concentrate on visual recordings, while feature-management services focus on feature flags and controlled releases. The approach here is different: analytics, recordings, experimentation, feature management, surveys, errors, and data infrastructure are designed to work together.
For a team that only needs basic traffic statistics, a simpler analytics product may be easier to operate. On the other hand, product teams that regularly ask questions such as “Which users reached this feature?”, “Where did they drop off?”, “What happened during their sessions?”, and “Did the new release improve retention?” can benefit from having these capabilities connected.
The biggest distinction is therefore not simply the number of features. It is the workflow. The platform is particularly well suited to teams that want engineers and product builders to investigate customer behavior directly and use those findings while building and shipping software.
Conclusion
For teams building software products, understanding what users do is only half the challenge. The real value comes from connecting that information to decisions about what to build, what to fix, and what to test next.
This platform takes an unusually broad approach to that problem. Product analytics sits alongside session replay, feature flags, experimentation, surveys, error tracking, data infrastructure, and AI-oriented capabilities, giving technical teams a substantial toolkit for understanding and improving their products.
It may take some time to explore everything available, but that depth is also its biggest advantage. Startups can begin with the generous free usage tiers, while larger teams can expand into more advanced analytics and data workflows as their needs grow. For product engineers who prefer having detailed customer context close to the development process, it is a compelling option worth exploring.
Frequently Asked Questions (FAQ)
What is this platform mainly used for?
It is primarily used for product analytics, user behavior analysis, session replay, experimentation, feature flags, surveys, error tracking, and related product-development workflows.
Is there a free plan?
Yes. Several products include generous monthly free usage allowances. The published examples include 1 million product analytics events and 5,000 session recordings per month.
Is it suitable for startups?
Yes. The free usage tiers and usage-based pricing make it practical for many early-stage products, while the broader feature set can support teams as their applications grow.
Does it support session recording?
Yes. Session Replay allows teams to inspect recordings of real user sessions and use that information alongside product analytics to investigate user behavior.
Can developers use it with their applications?
Yes. Developer-focused SDKs, APIs, webhooks, integrations, SQL tooling, and application frameworks make it suitable for engineering-led teams.
Does it offer experimentation and feature flags?
Yes. Teams can use feature flags for controlled releases and experimentation tools for testing product changes and measuring their impact.
Can external data be connected?
Yes. The platform's context warehouse supports more than 120 sources and destinations, allowing teams to combine product information with data from external services.
Is it suitable for large teams?
It can be. The combination of analytics, data infrastructure, experimentation, observability, and developer tooling provides enough depth for more sophisticated product and engineering workflows.
AI Testing & QA , AI Analytics Assistant , AI Developer Tools , AI Productivity Tools .
These classifications represent its core capabilities and areas of application. For related tools, explore the linked categories above.

PostHog Alternatives Product

morse code t…

broop

AI Fruit

VideoDubber'…

Video To Text

QuickFlip.AI

YouMind

Monkey Eatin…

MacroMicro