

















Earnings Report
What is Earnings Report?
Keeping up with earnings season can quickly become a full-time research task. Investors often need to move between earnings calendars, conference calls, transcripts, SEC filings, investor presentations, and historical financial data just to understand what changed from one quarter to the next.
This platform brings those pieces into a focused earnings research workspace. Instead of treating each earnings event as an isolated document, it helps users follow companies, monitor upcoming results, listen to calls, review transcripts, track specific topics, and preserve useful observations for future research.
The experience is particularly useful for investors who maintain a watchlist and want a clearer way to prepare before an earnings release and review what management actually said afterward. The combination of real-time earnings information, historical data, financial filings, transcripts, and research notes makes the workflow much easier to manage.
Key Features
- Real-time earnings calendar covering upcoming and reported company results
- Live and archived earnings call recordings
- Interactive transcripts with timestamps and research notes
- AI-assisted transcript translation across eight supported languages
- Historical quarterly EPS and revenue data covering nearly two decades
- Access to official SEC filings including 10-K, 10-Q, and 8-K documents
- Real-time keyword and company monitoring
- Push notifications for important earnings events and schedule changes
- Investor presentation and PDF exports
- Personalized earnings watchlists
- Private research notes linked to specific earnings information
User Interface
The interface is designed around the way earnings research actually happens. Rather than presenting a huge market calendar with every possible event, users can build a more focused workflow around companies and topics they care about.
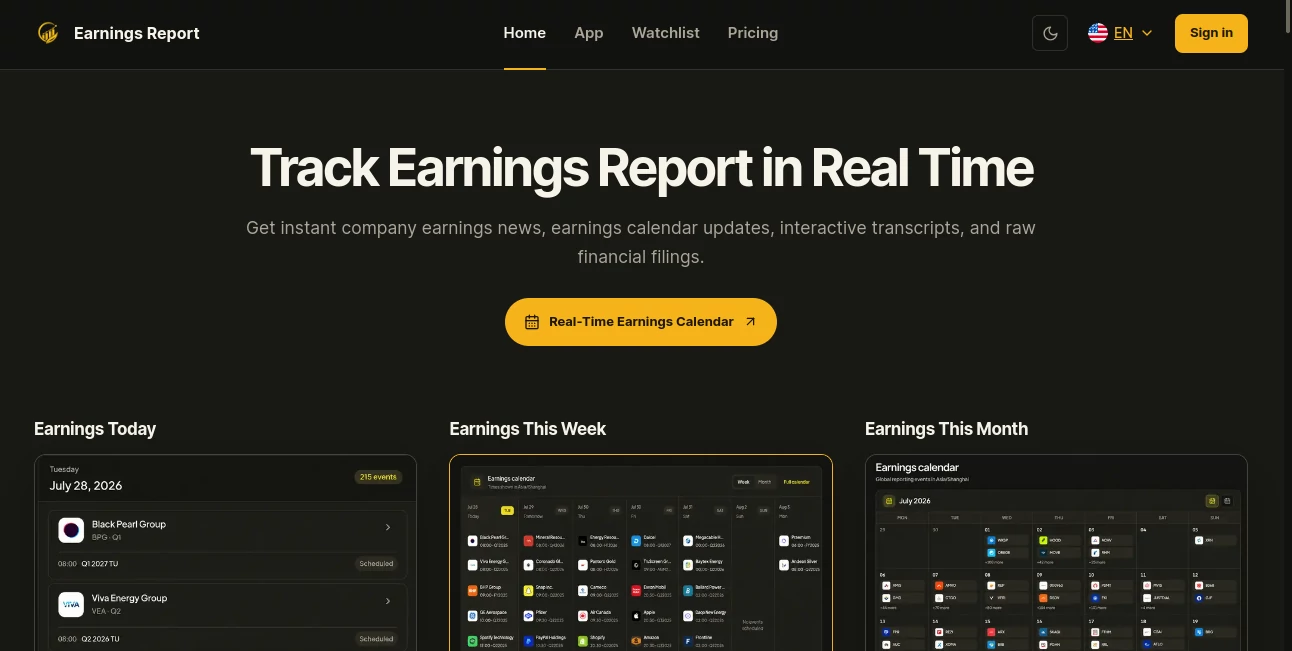
The calendar separates upcoming and completed events, while the research workspace keeps followed companies, transcripts, signals, and notes within reach. During a call, timestamps make it possible to jump directly to relevant moments instead of manually searching through an entire recording.
This is a welcome approach for anyone who has ever taken notes in one application while listening to a conference call in another and then struggled to remember where a particular statement came from.
Accuracy & Performance
Financial research depends heavily on source quality, and the platform places considerable emphasis on primary financial information. Users can access official SEC filings, corporate reports, investor presentations, earnings releases, call recordings, and historical financial metrics alongside their research workflow.
The historical database provides quarterly EPS and revenue information stretching back nearly two decades for thousands of public companies. That longer view can be useful when a single quarterly result does not tell the whole story.
Interactive transcripts also make research faster by connecting specific statements with timestamps. Instead of relying on a general summary, users can return to the exact part of a call that influenced their analysis.
Capabilities
The platform goes beyond simply displaying an earnings calendar. Users can discover upcoming calls, follow companies, monitor keywords and industry topics, listen to live or archived earnings calls, translate transcripts, and save important observations as private research notes.
For example, an investor following semiconductor companies could monitor several tickers while also tracking a topic such as margins, data-center demand, or product availability. When relevant information appears in an earnings transcript or release, it becomes easier to connect that event with the broader research process.
Another useful capability is document access. Official filings and investor presentations can be opened and exported, giving researchers source material that can be used for deeper analysis, financial models, or external AI workflows.
Security & Privacy
Research notes can contain personal investment ideas, observations, and conclusions, so keeping those notes within a dedicated workspace is practical. The platform provides private research notes as part of its earnings research workflow, allowing users to keep their interpretations together with the source information that prompted them.
For financial research, users should still review the platform's current privacy and legal documentation before entering information they consider highly sensitive. As with any financial research service, it is also sensible to verify important figures against the underlying corporate or regulatory documents.
Use Cases
- Earnings Season Preparation: Build a watchlist and see which companies are reporting before the next market-moving events.
- Earnings Call Research: Listen to live or archived calls and move directly to important sections through timestamped transcripts.
- Long-Term Company Analysis: Review historical EPS and revenue data to identify trends that are difficult to see from one quarter alone.
- Global Market Research: Translate earnings transcripts into one of eight supported languages when researching companies outside your primary language.
- Topic Monitoring: Follow custom keywords and industry subjects instead of manually checking every transcript.
- Financial Modeling: Export official filings, investor decks, and PDF reports for use in deeper financial analysis.
- Portfolio Monitoring: Keep important companies and upcoming earnings events in one personalized research workspace.
- Research Documentation: Save conclusions and observations alongside the relevant earnings source so they can be revisited during the next quarter.
Pros and Cons
- Pros: Real-time earnings calendar, live and archived calls, interactive transcripts, historical financial data, official SEC documents, keyword monitoring, multilingual translation, private research notes, and PDF or presentation exports.
- Pros: The workflow connects discovery, listening, reading, and note-taking instead of forcing investors to manage each part separately.
- Pros: The free plan provides a practical way to explore the core research experience before subscribing.
- Cons: AI-assisted research and translation features use research credits, so frequent users need to select a plan with enough monthly capacity.
- Cons: Users conducting research across a very large number of companies may need a paid plan to accommodate a broader workflow.
Pricing Plans
A free plan is available at $0 per month and includes three research credits each month, access to the earnings calendar, and available company materials. It is a useful starting point for occasional research or for users who want to test the workspace.
The Plus plan costs $15.80 per month when billed annually, with an annual charge of $190. It includes 300 research credits per month, transcript translation, financial reports, keyword monitoring, and research notes. This plan is aimed at investors following a focused watchlist and reviewing earnings calls regularly.
The Pro plan costs $40.80 per month when billed annually, with an annual charge of $490. It provides 650 research credits per month and includes the Plus features along with priority research workflows and support. It is positioned for more active earnings-season coverage and broader company research.
How to Use the Platform
Start by searching for a company, ticker, date, or research question. The earnings calendar can then be used to identify upcoming and completed earnings events.
Add companies to your watchlist if you want a more focused view of the businesses you follow. When an earnings call becomes available, you can listen to the live event or access the archived recording later.
During transcript research, use timestamps to move to relevant sections and save important observations as research notes. If the company reports in another language, the built-in translation capabilities can make the transcript easier to review.
For deeper analysis, open historical EPS and revenue information or examine the underlying SEC filings and investor presentations. This creates a useful path from an initial earnings event to a more complete research record.
Comparison with Similar Tools
Traditional earnings calendars are useful for answering one basic question: when is a company reporting? Financial news platforms can provide additional coverage, but investors may still need separate tools for transcripts, filings, call recordings, and personal research notes.
This platform takes a more research-oriented approach by connecting those activities. The biggest distinction is the continuity between an upcoming earnings event, the actual call, its transcript, historical financial information, source documents, and the investor's own notes.
It is therefore best suited to users who want more than a simple list of earnings dates. Someone who only checks quarterly release dates may not need the complete workspace, while an active investor, analyst, or financial researcher can benefit considerably from having these resources connected.
Conclusion
Earnings research becomes much more manageable when the calendar, conference call, transcript, financial filing, historical numbers, and personal conclusions do not live in completely separate places.
This platform provides a thoughtful workspace for that process. Its combination of real-time earnings monitoring, historical financial data, interactive transcripts, multilingual translation, official filings, keyword tracking, and research notes gives investors a practical way to move from simply knowing that a company is reporting to understanding what actually happened.
The free tier also lowers the barrier to trying the workflow, while the Plus and Pro plans provide more research capacity for users who follow earnings more actively. For anyone who regularly studies public companies around earnings season, it is a compelling addition to a financial research toolkit.
Frequently Asked Questions (FAQ)
What can I track with the platform?
You can track upcoming and completed earnings events, followed companies, keywords, industry topics, earnings calls, transcripts, financial reports, and research notes.
Can I listen to earnings calls?
Yes. The platform provides access to live earnings calls as well as archived recordings, allowing users to review company commentary after an event has finished.
Does it provide historical earnings data?
Yes. Historical quarterly EPS and revenue metrics are available for thousands of public companies, with data extending back nearly two decades.
Can earnings transcripts be translated?
Yes. AI-assisted transcript translation supports eight languages, including English, Chinese, Japanese, Korean, German, French, Spanish, and Portuguese.
Can I access SEC filings?
Yes. Users can access official SEC filings such as 10-K, 10-Q, and 8-K documents alongside other company financial materials.
Is there a free plan?
Yes. The free plan costs $0 per month and includes three research credits each month, earnings calendar access, and available company materials.
Who is this platform best suited for?
It is particularly useful for investors, analysts, and financial researchers who regularly follow earnings calls, compare quarterly results, monitor specific companies, or need a structured place to preserve research findings.
AI Investing Assistant , AI Research Tool , AI Analytics Assistant , Business .
These classifications represent its core capabilities and areas of application. For related tools, explore the linked categories above.
Earnings Report details
Website unavailable — View Alternatives
Pricing
- Free
Apps
- Web App
Categories

Earnings Report Alternatives Product

Rabbitholes …

Medialyst

CapyQR

Prelight

ForexCoupons

PortBackLinks

YTVidHub-you…

AISEOMate

ModelsLab
