


















figcanvas
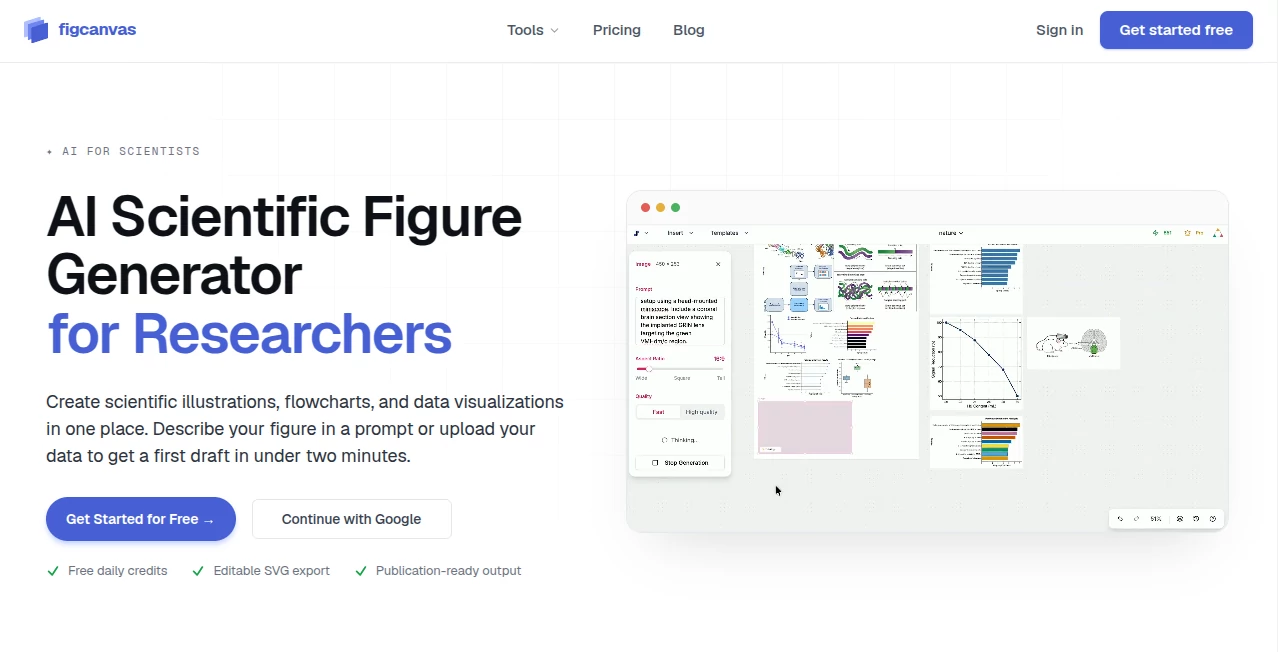
What is figcanvas?
Creating scientific figures has traditionally been one of the most time-consuming parts of academic writing. Designing diagrams, biological pathways, flowcharts, and research illustrations often requires advanced design software and hours of manual editing. This platform changes that experience by allowing researchers to describe what they need using natural language and receive polished, editable scientific visuals within minutes.
Designed specifically for scientists, educators, graduate students, and research teams, it focuses on producing publication-quality graphics instead of generic AI artwork. Whether preparing a journal manuscript, conference poster, thesis, or classroom presentation, users can quickly generate professional diagrams without extensive graphic design knowledge.
The platform combines artificial intelligence with research-focused visual understanding, making it an excellent choice for laboratories, universities, biotechnology companies, and anyone who regularly communicates complex scientific concepts through visual content.
Key Features
User Interface
The interface is refreshingly simple. Users can type a prompt, paste sections of their research methodology, or upload data to begin generating figures almost immediately. The workflow minimizes unnecessary complexity, allowing researchers to spend more time improving their research instead of learning complicated design software.
Accuracy & Performance
The system is optimized for scientific communication rather than general image generation. It produces vector-based illustrations suitable for publication, ensuring diagrams remain sharp at any resolution. Initial drafts are typically generated within a couple of minutes, enabling rapid iteration while papers are still being developed.
Capabilities
- Create publication-ready scientific illustrations.
- Generate biological mechanism diagrams.
- Produce pathway visualizations.
- Create laboratory schematics.
- Design professional flowcharts.
- Generate multi-panel research figures.
- Build charts including heatmaps, scatter plots, volcano plots, and bar charts.
- Export editable vector graphics for additional customization.
- Transform text descriptions into professional scientific visuals.
- Support academic papers, posters, presentations, and educational materials.
Security & Privacy
The platform operates entirely through a modern web browser without requiring local installation. Researchers maintain control over their editing workflow through editable vector exports, making it easier to review, refine, and integrate figures into publication pipelines. As with any cloud-based research tool, users should review the official privacy policy before uploading confidential or unpublished research data.
Use Cases
- Preparing figures for peer-reviewed journal publications.
- Designing scientific conference posters.
- Creating educational diagrams for university lectures.
- Building biological pathway illustrations.
- Generating laboratory workflow diagrams.
- Visualizing experimental procedures.
- Producing charts from research datasets.
- Creating graphical abstracts for scientific papers.
- Supporting biotechnology and pharmaceutical documentation.
- Improving communication within research teams.
Pros and Cons
Pros
- Built specifically for scientific research.
- Produces publication-quality vector graphics.
- Very easy for non-designers to use.
- Supports multiple scientific visualization types.
- Fast generation significantly reduces design time.
- Editable outputs simplify final adjustments.
Cons
- Primarily designed for scientific workflows rather than general graphic design.
- Advanced editing may still require external illustration software.
- Cloud-based usage may not suit organizations with strict offline requirements.
Pricing Plans
A freemium model allows new users to experiment with daily usage limits before upgrading. Paid subscriptions unlock additional credits, higher usage capacity, and more advanced capabilities for researchers and professional teams. Pricing may change over time, so checking the official website is recommended for the latest details.
How to Use FigCanvas
Start by creating an account and opening a new project. Describe the figure you need using plain English, paste your methodology, or upload relevant data. Within a short time, the AI generates an initial scientific illustration that can be refined, edited, and exported as an editable vector graphic. The finished figure can then be inserted directly into research papers, presentations, or academic posters.
Comparison with Similar Tools
Unlike traditional illustration software that requires manual drawing skills, this solution automates much of the creative process using artificial intelligence. Compared with general AI image generators, it focuses specifically on scientific communication, producing diagrams that better match academic standards and publication requirements. Researchers who need biological illustrations, laboratory schematics, or research figures are likely to find it more suitable than general-purpose design platforms.
Conclusion
Researchers often spend countless hours polishing figures that communicate only a small part of their overall work. This platform dramatically shortens that process by transforming simple descriptions into publication-ready scientific visuals. Its emphasis on accuracy, editable vector graphics, and research-focused workflows makes it a valuable companion for academics, educators, graduate students, and scientific organizations looking to present complex information clearly and professionally.
Frequently Asked Questions (FAQ)
Who is this platform designed for?
It is primarily intended for researchers, graduate students, educators, laboratories, and scientific organizations.
Can it generate publication-quality figures?
Yes. The platform focuses on producing professional scientific illustrations suitable for journals, posters, and presentations.
Does it support editable exports?
Yes. Generated figures can be exported as editable vector graphics for further refinement.
Can I create charts and flowcharts?
Yes. The platform supports flowcharts, scientific diagrams, biological illustrations, and multiple research chart types.
Is there a free version available?
Yes. A freemium plan allows users to explore the platform before upgrading to paid plans.
AI Charting , AI Diagram Generator , AI Education Assistant , AI Research Tool .
These classifications represent its core capabilities and areas of application. For related tools, explore the linked categories above.

figcanvas Alternatives Product

SciFig

YTVidHub-you…

MakeGraph

DidYouSEO

YT Video Sum…

Quso AI

Needle

Robux Tax Ca…

LocalRAG!