

















PaperBanana
What is PaperBanana?
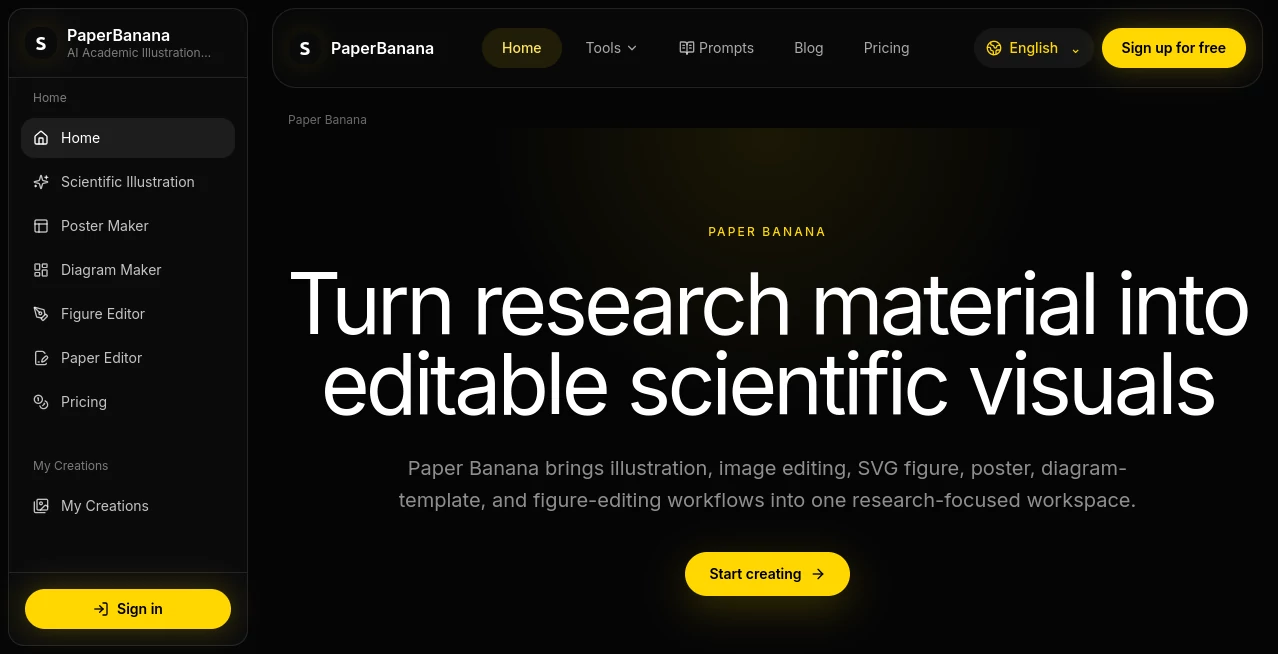
PaperBanana is built for researchers, students, educators, and anyone who needs clear academic visuals without spending hours inside complicated design software. Its main focus is turning research material into scientific illustrations, diagrams, editable figures, and presentation-ready visuals.
What makes the platform particularly interesting is its research-first approach. Instead of treating scientific graphics like ordinary image generation, it encourages users to define the visual task, organize the relevant information, generate a draft, and then review the result against the original source. This is a practical workflow for papers, presentations, academic posters, and research communication.
The workspace brings several related tasks together, including AI illustration, reference-image editing, SVG figure creation, poster creation, and figure editing. That combination can save researchers from jumping between multiple tools just to prepare one polished visual.
Key Features
- AI-assisted scientific illustration generation for academic concepts and research material.
- Editable academic figures designed for use in papers and presentations.
- Text-to-SVG and image-to-SVG workflows for creating editable vector figures.
- Reference-image editing for adapting existing visual layouts to new research content.
- Poster creation from research papers and PDF material.
- Multiple model options and generation candidates for comparing different visual drafts.
- Controls for image size, resolution, aspect ratio, and candidate count.
- Dedicated workflows for methodology diagrams, scientific workflows, graphical abstracts, and research figures.
User Interface
The interface is organized around the task a researcher wants to complete rather than presenting a confusing collection of unrelated creative tools. Users can choose between workflows such as AI illustration, image editing, SVG figures, and posters before configuring the generation.
The workspace also provides practical controls for selecting a model, choosing a semantic preset, defining the methodology, setting image size and resolution, and deciding how many candidates to generate. This makes the process feel closer to preparing a research asset than casually experimenting with an image generator.
Accuracy & Performance
For academic graphics, visual quality is only half the job. A diagram can look impressive and still communicate the wrong relationship between two concepts. The platform addresses this by encouraging users to treat generated visuals as drafts that require scientific review.
Its workflow specifically recommends checking labels, abbreviations, units, symbols, arrows, relationships, hierarchy, and reading order against the original research material. That is a sensible approach for scientific communication and helps users avoid accepting a polished-looking result without checking its meaning.
Generation costs also vary according to the task. AI illustration starts at 10 credits per candidate, custom illustration starts at 15 credits, reference-image editing uses 10 credits per task, SVG figure generation uses 20 credits, and poster generation uses 12 credits. Figure and paper editing tasks have their own credit requirements.
Capabilities
The strongest part of the platform is the range of academic visual workflows available in one place. A researcher can start with a written explanation of a mechanism, turn a methodology outline into a diagram, adapt a reference layout for a new study, or continue working on a generated figure inside an SVG-oriented workflow.
It can also be useful when the final output needs to be editable rather than simply exported as a static picture. SVG figure generation gives users a route toward adjusting labels, layers, ordering, and other visual elements after generation.
Another useful capability is poster creation. Rather than designing an academic poster completely from scratch, users can use research material as the starting point and then refine the resulting composition for the intended conference or presentation context.
Security & Privacy
The platform states that it uses encrypted transport, secure authentication, access controls, and cloud infrastructure to support its services. Account information, billing metadata, prompts, uploaded source files, generated visuals, credit usage, and basic device information may be processed as part of operating the service.
Payment-card details are handled by Stripe and PayPal rather than being stored as complete card numbers by the platform. AI generation requests and temporary source files may also be processed by Kie.
Researchers should still use normal caution when working with unpublished research or sensitive material. The service itself recommends avoiding uploads that are not necessary for a particular generation task.
Use Cases
Research papers: Researchers can create scientific figures, methodology diagrams, and graphical explanations that make complex material easier to understand.
Academic presentations: A written research concept can be transformed into a visual suitable for presentation slides, helping an audience understand the idea without reading a dense paragraph.
Scientific workflows: Methods involving multiple stages, entities, or relationships can be represented as structured diagrams rather than lengthy textual explanations.
Conference posters: Researchers preparing conference material can use the poster workflow as a starting point and refine the result for their final presentation.
Teaching and education: Educators can turn complicated mechanisms or processes into visual material that is easier for students to follow.
Existing figure adaptation: When the general structure of an existing diagram is useful but the research content has changed, the reference-image workflow can provide a starting point for a new version.
Pros and Cons
Pros
- Designed specifically around academic and scientific visual communication.
- Combines illustration, diagram, SVG, editing, and poster workflows.
- Supports editable scientific figures rather than focusing only on static images.
- Provides a structured review process for checking generated research visuals.
- Offers several generation models and configurable output settings.
- Includes commercial licensing in its paid plans.
Cons
- Generated scientific visuals still require human verification before publication.
- Credit consumption varies by workflow, which can make frequent experimentation more expensive.
- Researchers looking for a general-purpose image generator may find the academic focus narrower than necessary.
- Some complex research relationships may still require manual editing and domain review.
Pricing Plans
The platform uses a credit-based pricing system with monthly, yearly, and pay-as-you-go purchasing options. Monthly subscriptions currently include Basic, Plus, and Enterprise tiers.
The Basic plan is listed at $19 per month, with a promotional price of $9.50 per month shown on the current pricing page. It includes 5,040 credits per year on annual billing, commercial licensing, priority generation, watermark-free downloads, support for several image models, scientific illustration, paper editing, poster creation, and editable SVG diagrams.
The Plus plan is listed at $39 per month, with a promotional price of $19.50 per month on the current page. It provides 12,960 annual credits and the same major workflow categories, while Enterprise is listed at $69 per month, with a promotional price of $34.50 per month and 28,800 annual credits.
Annual billing is currently advertised with a 50% saving. Users who do not want a recurring subscription can also choose pay-as-you-go credit packs, making the pricing structure suitable for both ongoing research work and shorter projects.
How to Use PaperBanana
Start by defining exactly what the visual needs to communicate. For example, if the goal is to explain a research methodology, identify the main entities, relationships, sequence, labels, and important numbers before generating anything.
Next, choose the workflow that matches the task. Text-led concepts can be handled through illustration generation, an existing reference can be adapted through image editing, structured figures can be created through the SVG workflow, and research material can be used as the basis for a poster.
Configure the available generation settings, including the model, image size, resolution, aspect ratio, or number of candidates. Generate the drafts and compare them rather than automatically choosing the first attractive result.
Finally, review every important scientific detail. Check labels and symbols, trace arrows and relationships back to the source, confirm that the reading order makes sense, and make any necessary edits before exporting the final visual.
Comparison with Similar Tools
General AI image generators are useful when the main goal is producing an attractive picture, but scientific communication has different requirements. A research diagram needs accurate terminology, meaningful relationships, appropriate hierarchy, and a clear connection to the underlying study.
This platform takes a more specialized route. Its workflows are organized around research figures, scientific illustrations, diagrams, editable SVG output, and academic posters. The ability to continue editing a generated figure is also valuable for researchers who need control over labels, layers, structure, and final presentation.
For someone who only wants decorative images, a general image generator may be simpler. For a researcher who needs a visual explanation of a method, mechanism, workflow, or study, the research-oriented workflow is a more natural fit.
Conclusion
Creating scientific visuals can be surprisingly time-consuming, particularly when the information needs to be both visually appealing and faithful to the research. PaperBanana approaches this problem with a workflow designed specifically for academic illustration and research figures.
Its combination of AI illustration, editable SVG figures, reference-image editing, poster creation, and structured review makes it useful for researchers who regularly prepare papers, presentations, diagrams, and conference material.
The most important point is that the platform does not replace scientific judgment. Its generated visuals should be treated as drafts and checked against the original research. Used that way, it can become a practical part of the process from a rough research concept to a clearer, more polished visual.
Frequently Asked Questions (FAQ)
What is this tool mainly used for?
It is primarily designed for creating and editing academic and scientific visuals, including research figures, diagrams, illustrations, SVG graphics, and academic posters.
Can it create diagrams from research material?
Yes. Users can describe a methodology, process, mechanism, or other research concept and generate a visual draft that can then be reviewed and edited.
Can the generated figures be edited?
Yes. The platform includes figure-editing and SVG-oriented workflows, allowing users to continue refining labels, structure, layers, and other elements.
Can it create academic posters?
Yes. The Poster Maker workflow is designed for creating academic poster drafts from research material, including PDF papers.
Does it guarantee that a scientific diagram is correct?
No. Generated visuals should be reviewed by the researcher or another qualified domain expert. The platform itself emphasizes checking scientific terminology, relationships, arrows, units, and conclusions before publication.
How does the credit system work?
Different tasks consume different numbers of credits. For example, AI illustration starts at 10 credits per candidate, SVG figure generation uses 20 credits per task, and poster generation uses 12 credits per task.
Does it offer a free plan?
The current pricing page focuses on paid monthly, yearly, and pay-as-you-go credit options. The availability of any free usage or promotional credits can depend on the current service configuration.
Who can benefit from this platform?
Researchers, students, educators, academics, and professionals who regularly need scientific figures, diagrams, research illustrations, presentations, or conference posters can benefit from its specialized workflow.
Is it suitable for publishing research figures directly?
It can help prepare research figures, but generated content should always be checked carefully for scientific accuracy, terminology, relationships, and formatting before it is submitted for publication.