


















QuantiBot.ai
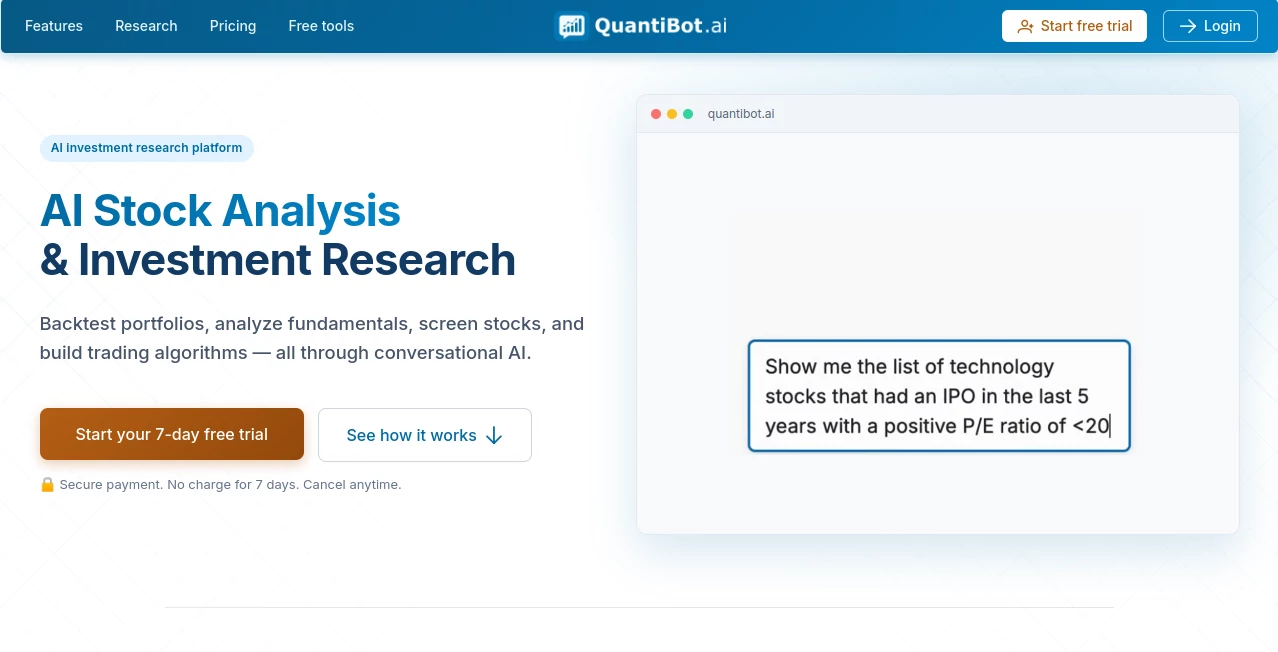
What is QuantiBot.ai?
For many investors, the hardest part of researching a stock is not finding information. It is putting financial statements, valuation data, technical signals, historical performance, and portfolio risk into one coherent picture. This platform takes a conversational approach to that problem, allowing users to explore investment research in plain English rather than working through complicated formulas, spreadsheets, or specialized query syntax.
The platform is built for both individual investors and more experienced users who want a faster way to investigate an idea. It covers thousands of stocks and ETFs, company fundamentals, technical indicators, historical market data, portfolio analysis, and strategy backtesting. A useful detail is that users do not need to write code to test an investment strategy or investigate a quantitative question.
There is also a free stock backtester that can be used without creating an account. Users can select a preset strategy and a ticker, run the test across a three-year historical window, and review metrics such as returns, Sharpe ratio, beta, stress scenarios, and the historical trade log.
Key Features
- Conversational stock and investment research using natural-language questions.
- Fundamental analysis covering revenue, earnings, margins, profitability, cash flow, valuation, and related financial information.
- Research coverage for thousands of stocks and ETFs.
- Technical analysis using indicators and chart patterns.
- Portfolio backtesting with historical performance and risk measurements.
- No-code research and backtesting for rule-based investment strategies.
- Stock screening based on factors such as value, quality, momentum, and low volatility.
- Historical portfolio stress testing using previous market conditions.
- Portfolio correlation and sector or factor exposure analysis.
- Portfolio tracking with plain-English daily summaries and watchlist alerts.
- Saved research, portfolios, strategies, screeners, and reusable prompts.
User Interface
The interface is designed around conversation rather than a traditional collection of financial dashboards. Instead of learning a specialized query language, a user can describe what they want to investigate in ordinary language and continue asking follow-up questions as the research develops.
This approach can be particularly useful when an initial question leads to another. For example, someone researching a company can start with its fundamentals, compare it with peers, examine valuation, look at technical signals, and then move the idea into a historical backtest. Keeping these activities within the same research workflow makes the experience feel less fragmented.
Accuracy & Performance
The platform grounds its research in market and company data rather than relying solely on a conversational answer. Its stock analysis can examine fundamental trends, historical performance, valuation, and risk, while technical research is calculated from market data and presented in plain language.
For quantitative research, historical backtesting adds another useful layer. Users can see how a portfolio or strategy would have behaved during a selected historical period, including returns, drawdowns, volatility, and risk-adjusted measurements. These results are useful for studying an idea, although they should not be interpreted as a prediction of future performance.
As with any automated financial research system, users should independently verify important figures and conclusions before relying on them. The platform itself clearly states that its outputs are intended for informational and educational purposes and are not investment advice.
Capabilities
The range of research functions is one of the strongest parts of the platform. Fundamental analysis can follow financial trends across multiple quarters rather than focusing only on the latest reported number. Users can investigate revenue and earnings, profitability, margins, cash flow, valuation multiples, and other financial characteristics.
Technical research covers indicators such as RSI, MACD, Bollinger Bands, ATR, Stochastic indicators, and candlestick patterns. This gives users a way to investigate the technical picture without manually interpreting every chart.
The screening tools can narrow thousands of securities into a smaller research universe using criteria such as value, quality, momentum, low volatility, valuation ratios, and other factors. Users can then move from screening into deeper analysis.
For strategy research, users can describe rule-based ideas in plain language. Supported research areas include technical strategies, mean reversion, factor or smart-beta approaches, earnings-based strategies, sentiment strategies, and custom algorithms. Rotation and momentum research is also available, including different weighting approaches.
Security & Privacy
The service positions itself as an investment research and analysis platform rather than a brokerage. It does not execute trades or place orders on behalf of users, which creates an important separation between researching an investment idea and actually making a transaction.
The website also provides dedicated legal and privacy information and uses secure payment messaging around its subscription process. Users who plan to enter personal portfolio information should review the current privacy policy and terms before using the service for sensitive research.
Use Cases
Individual stock research: Investors can ask questions about a company, examine its financial condition, investigate valuation, and compare its historical performance with relevant peers.
Portfolio analysis: Users can enter holdings and examine performance, correlations, sector exposure, factor exposure, concentration, and historical risk.
Strategy development: Someone with an investment idea can describe a rule-based strategy and test how it would have behaved historically without writing a programming script.
Stock screening: Instead of manually reviewing thousands of securities, users can define research criteria and create a more focused shortlist for further investigation.
Risk research: Historical stress testing can help users understand how a portfolio might have behaved during previous difficult market periods.
Learning quantitative finance: The plain-English explanations can be useful for people who understand investing but are less comfortable with financial formulas, quantitative terminology, or coding.
Pros and Cons
- Pros: Natural-language research makes quantitative analysis easier to approach.
- Pros: Covers stock analysis, screening, portfolio research, technical analysis, and backtesting in one environment.
- Pros: No coding is required for many of the research workflows.
- Pros: Thousands of stocks and ETFs are available for research.
- Pros: The free browser-based backtester provides a useful way to try historical strategy testing without signing up.
- Pros: Portfolio correlation, exposure, and stress-testing features go beyond simple stock lookup.
- Cons: Historical backtests cannot guarantee how a strategy will perform in the future.
- Cons: It is a research platform rather than a brokerage or trade-execution service.
- Cons: Users who need highly specialized professional quantitative workflows may still require dedicated financial software.
Pricing Plans
The service offers a 7-day free trial for new subscribers, with no charge during the trial period. The monthly subscription is priced at $49.99 per month after the trial, while the annual option costs $499.90 per year.
The annual plan is presented as the better-value option and includes two months free compared with paying the monthly price for a full year. Both paid options provide access to the full feature set, including the conversational research interface, backtesting capabilities, and AI-assisted analysis covering fundamental, performance, valuation, and risk research.
There is also a free stock backtester that does not require a card or account. It provides a practical way to experience the historical testing workflow before committing to a subscription.
How to Use the Platform
- Start by choosing a stock, ETF, portfolio, or investment question you want to research.
- Describe your question in plain English instead of building a complicated financial query.
- Review the resulting fundamental, technical, performance, valuation, or risk information.
- Ask follow-up questions to investigate a specific metric or compare the security with other companies.
- Use the stock screener when you want to find securities matching particular investment criteria.
- Move a portfolio or strategy into the backtesting workflow to examine historical behavior.
- Review drawdowns, volatility, returns, risk-adjusted results, and historical trades where applicable.
- Save useful research, watchlists, portfolios, screeners, strategies, or prompts for later reference.
Comparison with Similar Tools
Traditional investment research platforms often require users to move between financial statements, screening interfaces, charting tools, spreadsheets, and separate backtesting software. The main difference here is the attempt to bring many of those research activities into a conversational workflow.
Compared with a basic stock screener, the platform goes further by allowing users to continue from a shortlist into fundamental analysis, technical research, peer comparison, portfolio analysis, or historical testing. Compared with a conventional backtesting application, its no-code conversational approach can make strategy exploration more approachable for users who do not want to build scripts.
It is not intended to replace a brokerage account or professional trading infrastructure. Its strength is the research stage: investigating ideas, understanding historical behavior, and organizing quantitative information before making an independent decision.
Conclusion
This platform is a compelling option for investors who want deeper quantitative research without spending hours building spreadsheets or learning financial programming. Its combination of conversational analysis, stock screening, fundamental research, technical signals, portfolio analytics, and historical backtesting gives it a broader role than a simple AI stock lookup tool.
The free backtester is a particularly convenient starting point, while the paid plans make more sense for users who regularly conduct investment research and want to keep their work organized in one place. The most important point to keep in mind is that historical results and AI-generated analysis are research inputs, not guarantees. Used with that distinction in mind, the platform can make a traditionally time-consuming part of investing considerably easier to explore.
Frequently Asked Questions (FAQ)
What type of investment research can I perform?
You can research stocks and ETFs, company fundamentals, valuation, technical indicators, historical performance, portfolio risk, correlations, market factors, and rule-based investment strategies.
Do I need coding skills?
No. The platform is designed to support natural-language research and no-code strategy backtesting, making it accessible to users who do not write financial scripts.
Can I backtest an investment strategy?
Yes. You can describe rule-based strategies in plain language and test them against historical market data. Technical, mean-reversion, factor, earnings, sentiment, and custom strategies are supported.
Can I test a portfolio?
Yes. Real or hypothetical portfolios can be evaluated against historical market conditions, with measurements including returns, drawdowns, volatility, and risk-adjusted performance.
Can I screen stocks?
Yes. The stock screening workflow can filter thousands of securities using criteria such as value, quality, momentum, low volatility, and valuation-related factors.
Does the platform execute trades?
No. It is designed for investment research and analysis and does not place orders or act as a brokerage service.
Is the analysis investment advice?
No. The service states that its outputs are for informational and educational purposes. Users remain responsible for independently evaluating information and making their own investment decisions.
Is there a free option?
Yes. A browser-based stock backtester is available without an account or payment card. New subscribers can also access a 7-day free trial of the full service.
How much does the full service cost?
The monthly plan costs $49.99 per month after the 7-day trial. The annual plan costs $499.90 per year and is presented as including two months free.
Can I track my portfolio?
Yes. Users can track holdings, review their movements, receive plain-English daily briefs, and configure watchlist or screener alerts.
Can I analyze portfolio diversification?
Yes. The platform can measure correlations between securities and examine sector, factor, and concentration exposure to help users understand how positions interact with one another.
AI Investing Assistant , AI Research Tool , AI Analytics Assistant , AI Trading Bot Assistant .
These classifications represent its core capabilities and areas of application. For related tools, explore the linked categories above.
QuantiBot.ai details
Website unavailable — View Alternatives
Pricing
- Freemium
Apps
- Web App
Categories

QuantiBot.ai Alternatives Product

MacroMicro

GLM 5

KarmaGuy

Zorin

Diploria AI

SciSpace

mainaro

Weekly Brief

AyeWatch AI