













Traccia
What is Traccia?
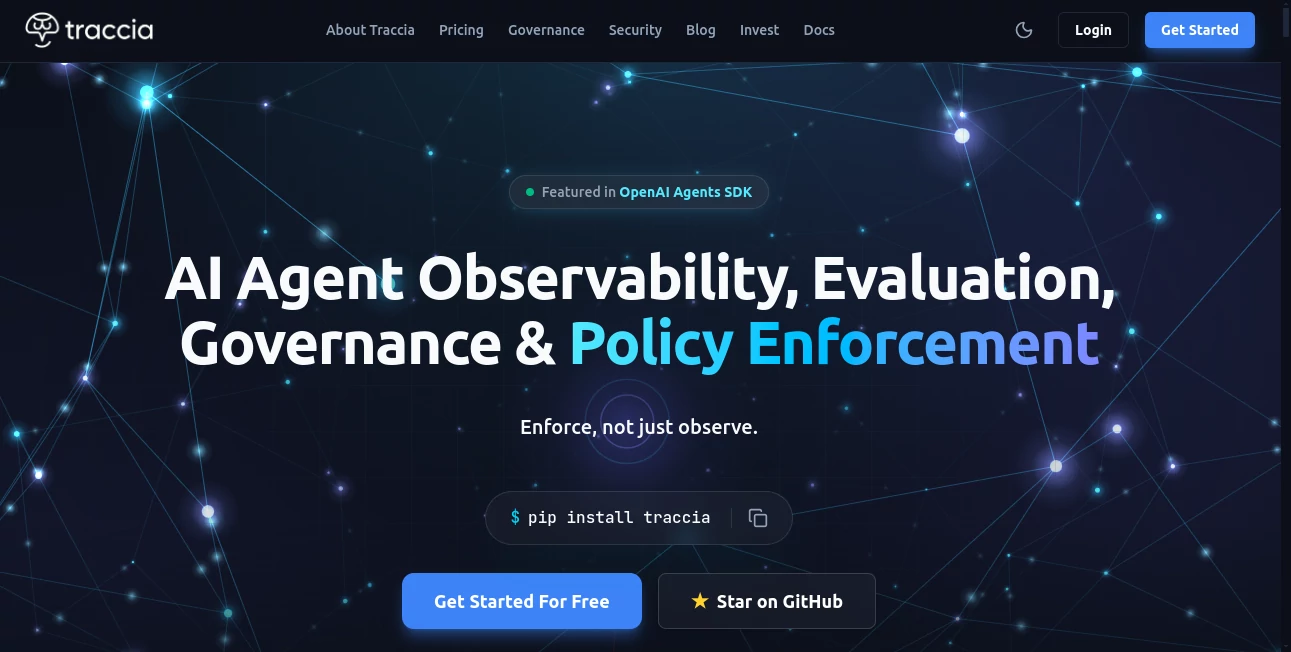
Traccia is an AI agent observability and governance platform built for teams that need a clearer picture of what their agents are doing in production. Instead of looking only at whether an AI application returned an answer, it lets developers follow agent execution, inspect LLM calls, track costs, review prompts, monitor policy violations, and collect compliance evidence from a central dashboard.
The platform is built around OpenTelemetry, which makes it useful for teams working with different AI frameworks rather than being tied to a single development ecosystem. It supports integrations including LangChain, CrewAI, OpenAI Agents SDK, AutoGen, and LlamaIndex, while OpenAI and Anthropic applications can receive automatic token and cost tracking.
For a team running several agents at once, this kind of visibility can make troubleshooting much less frustrating. Instead of searching through separate logs and spreadsheets to understand why an agent became expensive or started producing errors, developers can follow its execution from a single place.
Key Features
- OpenTelemetry-native tracing for AI agents and LLM applications
- Unified agent registry for monitoring agents across environments
- End-to-end traces covering LLM calls, tool usage, and agent decisions
- Token and cost attribution across more than 2,500 models
- Policy monitoring and guardrail detection
- PII and sensitive-data detection with optional SDK redaction
- Prompt registry with version history and production labels
- Prompt playground for comparing models and prompt versions
- Datasets, scorers, and experiment comparisons
- Compliance evidence for areas such as the EU AI Act and HIPAA controls
User Interface
The dashboard is designed around operational visibility rather than simply presenting raw logs. Teams can see agent status, environments, executions, errors, policy violations, and token spending without jumping between several monitoring systems.
The agent registry is particularly useful for organizations with multiple AI applications. It provides a central inventory where teams can see which agents are running, where they are deployed, who owns them, and how they are behaving. The trace explorer then provides a more detailed view of individual executions, including timelines, LLM calls, tool usage, and associated costs.
Accuracy & Performance
Cost visibility is one of the stronger aspects of the platform. Token and cost information can be calculated locally at span end, allowing teams to understand the expense associated with individual agents, models, and tasks. The platform also separates cost metrics from trace sampling, helping maintain cost visibility even when organizations sample a smaller percentage of traces for observability.
For developers investigating slow or unreliable agents, execution timelines can expose where time is being spent. A workflow might look healthy at the application level while one particular knowledge-base lookup, tool call, or model request is responsible for most of the delay. Detailed traces make those bottlenecks easier to spot.
Capabilities
The platform goes beyond conventional tracing by combining observability with evaluation and governance features. Developers can maintain versioned prompts, compare candidate prompts against production versions, and evaluate results using datasets, built-in checks, LLM-based judging, or custom scorers.
Governance features provide another layer of control. Teams can define policies around areas such as tool calls, restricted models, and spending. The system can identify violations and surface them in the governance dashboard, while its documentation also describes enforcement-oriented controls for stopping problematic agent behavior.
Another practical capability is sensitive-data detection. The SDK can optionally redact certain personally identifiable information before traces are exported, which can reduce the chance of sensitive information appearing unnecessarily in observability data.
Security & Privacy
Security is clearly positioned as an important part of the platform, particularly for companies operating AI agents in production. The service states that SOC 2 Type II certification is in progress and provides enterprise-oriented access controls and governance capabilities.
Optional PII redaction is available through the SDK, allowing organizations to mask supported sensitive information before exporting traces. The platform also provides governance and audit-oriented features, including compliance evidence exports and controls designed around regulatory requirements.
Organizations should still review the current security documentation and contractual terms before sending sensitive production data to any external platform. This is especially important for regulated workloads where retention, data residency, access controls, and compliance responsibilities need to be assessed against internal requirements.
Use Cases
AI Agent Monitoring: Development teams can monitor multiple agents from one dashboard and quickly investigate errors, latency, throughput, and execution behavior.
LLM Cost Management: Teams can identify expensive agents, models, and operations instead of relying on a single overall API bill. This can be particularly valuable when an application uses several models or performs many calls during a single workflow.
Prompt Evaluation: Product and engineering teams can compare new prompt versions against existing production prompts using datasets and measurable scoring criteria before making changes.
AI Governance: Organizations can monitor policy violations and maintain a clearer record of how their agents are being operated, which becomes increasingly important as AI systems move into customer-facing and business-critical workflows.
Compliance Workflows: Teams working with regulated AI applications can use the available compliance evidence and governance features to organize information needed for audits and internal reviews.
Multi-Framework Development: Because the SDK is OpenTelemetry-native, teams using different agent frameworks can maintain a common observability approach instead of adopting a completely separate monitoring solution for every framework.
Pros and Cons
Pros:
- OpenTelemetry-native architecture
- Supports several popular AI agent frameworks
- Detailed tracing for agent and LLM activity
- Strong focus on cost and token attribution
- Prompt management and evaluation are built into the same platform
- Governance and compliance features are available alongside observability
- Optional PII redaction helps reduce exposure of sensitive information in traces
- An open-source SDK can also be used with external OpenTelemetry-compatible backends
Cons:
- The number of features may feel extensive for a developer who only needs basic LLM logging
- Advanced governance and analytics capabilities are reserved for higher pricing tiers
- Teams with strict compliance requirements still need to conduct their own security and legal review
- Some advanced enforcement capabilities are part of the platform's evolving roadmap
Pricing Plans
The pricing model is based on platform usage rather than charging per user. This can be attractive for teams that need to invite several developers, operators, or stakeholders without increasing the bill for every additional seat.
- Hobby: Free, with 50,000 included events and 7-day retention.
- Observe: $99 per month, with 500,000 included events and 30-day retention.
- Govern: $299 per month, with 2 million included events and 90-day retention.
- Scale: $799 per month, with 10 million included events and 1-year retention.
- Enterprise: Custom pricing, event volume, and retention.
Paid plans do not use per-seat pricing. Higher plans also reduce the additional cost per event, making the pricing structure more suitable for organizations expecting their AI workloads to grow.
How to Use It
- Install the SDK in your AI application using the package provided in the documentation.
- Initialize tracing and connect the application to the desired observability destination.
- Add the appropriate observation decorators or spans around agent workflows and important operations.
- Connect supported frameworks such as LangChain, CrewAI, OpenAI Agents SDK, AutoGen, or LlamaIndex when applicable.
- Open the dashboard to inspect agent executions, errors, latency, tokens, and costs.
- Use the prompt registry and evaluation features when testing changes to prompts or models.
- Configure governance policies and review detected violations as your application moves toward production.
A developer who wants to keep infrastructure under their own control can also use the open-source SDK locally and export traces to OpenTelemetry-compatible systems such as Jaeger, Grafana Tempo, Zipkin, or SigNoz.
Comparison with Similar Tools
Many AI observability products concentrate primarily on tracing and debugging. The approach here is broader, combining traces with agent inventory, cost attribution, prompt management, evaluation, governance, and compliance-oriented evidence.
Its OpenTelemetry foundation is another important distinction. Teams that expect to change frameworks over time may prefer a monitoring layer that is not designed around only one agent framework. For example, an organization can work with LangChain today and adopt another supported framework later without rebuilding its entire observability strategy from scratch.
For a small project that only needs basic request logging, this broader feature set may be more than necessary. For production AI systems with multiple agents, meaningful LLM spending, governance requirements, or frequent prompt experimentation, the additional capabilities become much more compelling.
Conclusion
AI agents can become difficult to manage once they move beyond a simple prototype. A single workflow may involve several model calls, external tools, retrieval systems, retries, prompts, and sensitive information, making traditional application logs insufficient for understanding what actually happened.
This platform brings many of those pieces together. Its combination of OpenTelemetry tracing, cost attribution, prompt evaluation, governance, PII protection, and compliance-oriented tooling makes it a strong option for engineering teams building serious AI applications.
The biggest appeal is not simply seeing what an agent did, but gaining the operational context around why it behaved that way, how much it cost, whether it followed defined policies, and whether a proposed change is actually better than the current version. For teams moving AI agents from experiments into production, that added visibility can be genuinely valuable.
Frequently Asked Questions (FAQ)
What is this platform used for?
It is used to trace, monitor, evaluate, and govern AI agents and LLM applications. Developers can inspect executions, track costs, manage prompts, evaluate changes, and monitor governance-related events.
Which AI frameworks are supported?
The platform supports LangChain, CrewAI, OpenAI Agents SDK, AutoGen, and LlamaIndex. Its OpenTelemetry architecture also allows broader integration with compatible systems.
Can it track LLM costs?
Yes. Token and cost attribution can be associated with agents, models, tasks, and individual spans. The documentation also describes cost calculation for supported LLM providers and custom pricing configurations.
Does it support OpenTelemetry?
Yes. OpenTelemetry is central to the architecture, and the SDK can export traces to compatible observability backends instead of requiring every team to use the hosted platform.
Is there a free plan?
Yes. The Hobby plan is free and includes 50,000 events with 7-day retention.
Can sensitive information be protected?
The SDK provides optional PII redaction that can mask supported sensitive information before traces are exported. Teams handling regulated information should still review the complete security and compliance requirements for their specific workload.
Is it suitable for production AI agents?
Yes. The platform is specifically designed around production observability, governance, cost management, and operational monitoring. Its usefulness is greatest when an organization has AI agents that need ongoing visibility rather than occasional debugging.
Can developers use the SDK without the hosted platform?
Yes. The open-source SDK can be used locally and can export traces through OpenTelemetry to external observability systems, giving developers more control over their infrastructure.
AI Developer Tools , AI Testing & QA , AI Monitor & Report Builder , AI DevOps Assistant .
These classifications represent its core capabilities and areas of application. For related tools, explore the linked categories above.

Traccia Alternatives Product
CtrlOps

Project Mela

Standard Com…
Gemini Omni

ClawBridge

Ito AI
Skillselion

DeepSeek

Lovable APP