


















Figwise
What is Figwise?
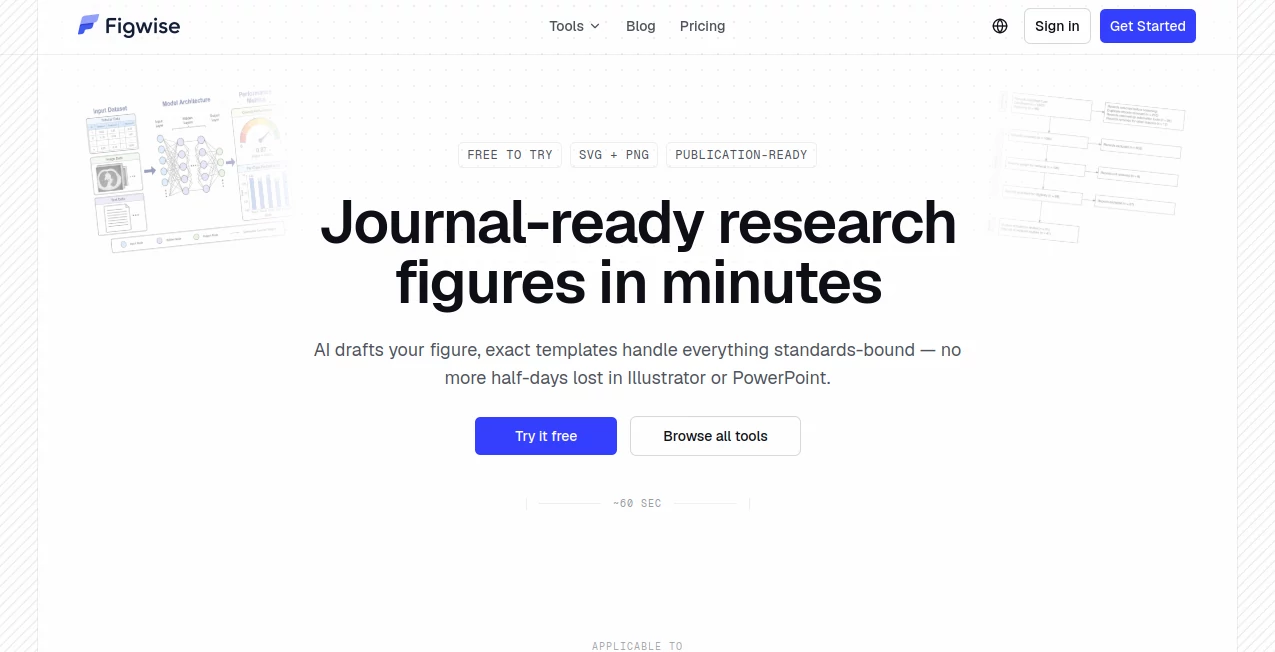
Creating a polished scientific figure can take far longer than the research behind it deserves. Researchers often end up moving boxes around in PowerPoint, adjusting labels in design software, or rebuilding diagrams whenever a reviewer asks for a small change. Figwise takes a more research-focused approach by using AI to draft scientific figures while keeping the final result editable and suitable for academic publishing.
The platform is built around practical research needs rather than general-purpose graphic design. Researchers can create graphical abstracts, conceptual frameworks, PRISMA and CONSORT diagrams, volcano plots, phylogenetic trees, forest plots, funnel plots, and other research figures from text, numbers, or structured data. The result can then be reviewed, adjusted, and exported for use in a paper, thesis, presentation, or journal submission.
One of the biggest advantages is the workflow. Instead of starting with a blank canvas, you start with the information already present in your research. That makes the process particularly useful when the goal is to communicate a study clearly without spending an afternoon designing every visual element manually.
Key Features
- AI-assisted generation of scientific figures from research descriptions and data.
- Graphical abstract generation from an existing paper abstract.
- Conceptual framework diagrams with automatic classification of variables.
- PRISMA 2020 and CONSORT 2010 flow diagram generation.
- Scientific plotting tools including volcano, forest, funnel, box, and heatmap plots.
- Phylogenetic tree generation from Newick format or species lists.
- Editable labels and layouts for generated figures.
- Journal-oriented sizing and export options.
- SVG and PNG export options for publication and presentation workflows.
- Free access to several tools without requiring a complicated setup.
User Interface
The interface is designed around individual research tasks rather than a traditional design canvas. You select the type of figure you need, provide the relevant information, review the generated result, and make adjustments where necessary.
This approach feels particularly sensible for researchers who are not trained in graphic design. Someone preparing a systematic review, for example, does not need to learn how to manually construct every box and connector in a PRISMA diagram. They can provide the relevant screening numbers and concentrate on checking the result.
The editing workflow also keeps the researcher in control. Generated labels can be reviewed and changed, which is important because scientific terminology needs to match the manuscript precisely.
Accuracy & Performance
The platform is strongest when the figure has a defined scientific structure. PRISMA and CONSORT diagrams, conceptual frameworks, statistical plots, and similar formats benefit from templates and rules that are easier to validate than a completely free-form image.
For example, a researcher can describe the relationships between independent, dependent, mediating, and moderating variables and receive a structured conceptual framework rather than a decorative illustration. Likewise, a volcano plot can be created from differential-expression data with adjustable thresholds.
AI-generated material should still be checked before publication. The service itself advises users to verify scientific accuracy, since generated results can contain mistakes. That is a sensible limitation to keep in mind: the tool can accelerate figure creation, but the researcher remains responsible for the scientific content.
Capabilities
The range of specialized tools is one of the platform's most attractive features. A researcher working on a systematic review can create a PRISMA 2020 flow diagram, while someone conducting a clinical trial can work with a CONSORT 2010 diagram. Quantitative researchers can create forest and funnel plots, while molecular and biological researchers can work with volcano plots and phylogenetic trees.
The graphical abstract workflow is another useful capability. Researchers can paste an abstract, receive several visual layouts, and then edit the wording and positioning of labels. This is much closer to the way an academic author actually works: the first draft provides structure, while the researcher makes the final decisions.
Export options are also designed with academic workflows in mind. Depending on the tool, figures can be exported as PNG or vector SVG files, making them suitable for manuscripts, slides, theses, and other research materials.
Security & Privacy
Privacy matters when working with unpublished research, manuscripts, and study information. The service states that users retain rights to content they submit, including abstracts, descriptions, and data. It also explains that generation requests are processed through third-party AI model providers.
Researchers should therefore review the privacy terms and the requirements of their institution before submitting sensitive or confidential material. It is also worth remembering that academic publishers may have their own policies regarding AI-assisted figures and disclosure.
Another important point is ownership. According to the service terms, generated figures may be used for academic and commercial purposes under the applicable terms, although users remain responsible for checking the scientific accuracy of the output and following the rules of their target journal.
Use Cases
Systematic Reviews: PRISMA 2020 diagrams can be created from screening numbers without manually rebuilding the familiar multi-stage flowchart.
Clinical Research: Researchers conducting randomized controlled trials can generate CONSORT-style participant flow diagrams based on their study numbers.
Theses and Dissertations: Conceptual frameworks can help students turn research hypotheses and variable relationships into a diagram that is easier for supervisors and readers to understand.
Graphical Abstracts: Authors can turn a paper abstract into a visual summary that communicates the study's input, method, and main outcome at a glance.
Biological and Genomic Research: Volcano plots and phylogenetic trees provide useful starting points for researchers working with expression data and evolutionary relationships.
Meta-analysis: Forest and funnel plots can make statistical results easier to present in research papers and reports.
Pros and Cons
- Pros: Strong focus on academic and scientific figures.
- Pros: Specialized tools for common research workflows.
- Pros: AI can create a useful first draft instead of starting from a blank canvas.
- Pros: Editable labels provide control over scientific terminology.
- Pros: Publication-oriented export options.
- Pros: Several tools can be tried without a traditional design-software workflow.
- Cons: AI-generated figures still require scientific review.
- Cons: Credit usage varies depending on the specific tool and generation.
- Cons: Journal policies regarding AI-generated figures can differ significantly.
Pricing Plans
The pricing model is based on credits rather than simply limiting access to a fixed number of designs. Users can choose monthly or yearly subscriptions, with yearly billing offering savings, or purchase one-time credit packs when they do not want a recurring subscription.
The Starter plan is listed at $15 per month, or $12 per month with yearly billing, and includes 20,400 credits per year. The Pro plan costs $29 per month, or $23 per month with yearly billing, and provides 50,400 credits per year. The Max plan is listed at $59 per month, or $45 per month with yearly billing, and includes 126,000 credits per year.
All three plans include access to the available models and styles, a commercial-use license, a permanent figure library, and automatic refunds for failed generations. The service also provides institution-friendly invoices with a tax ID option, which can be useful for researchers seeking reimbursement through a university or research grant.
The exact number of figures depends on the tool and generation settings. The site's estimates are based on AI generation at 1K resolution, so actual credit consumption can vary.
How to Use Figwise
Start by selecting the type of scientific figure that matches your research task. For a graphical abstract, paste the abstract from your manuscript. For a conceptual framework, describe the variables and expected relationships. For a PRISMA or CONSORT diagram, enter the relevant participant or screening numbers. Other tools can work directly with structured research data.
After entering the information, review the generated draft carefully. If the structure or terminology is not quite right, adjust the text or regenerate the figure. This review step is important because the generated visual should reflect the actual study rather than simply look attractive.
Once the figure is ready, choose the appropriate export settings. Depending on the tool, you can download a high-resolution PNG or vector SVG and then place the result into your manuscript, thesis, presentation, or submission workflow.
Comparison with Similar Tools
Traditional tools such as PowerPoint, Illustrator, and Inkscape provide extensive manual control, but they also require researchers to build much of the figure themselves. They are excellent choices when complete design freedom is the priority, yet they can become time-consuming for standardized research diagrams.
General-purpose AI image generators have the opposite problem. They can create attractive visuals quickly, but scientific diagrams often contain precise labels, relationships, numbers, and structured components that need to remain accurate and editable.
Dedicated scientific illustration platforms may provide richer visual libraries, while specialized statistical software can offer deeper analytical functionality. The advantage here is the combination of several research-specific figure workflows in one place, with AI handling the initial drafting and structured templates helping keep the output organized.
For researchers who repeatedly create academic figures and want to reduce the amount of manual layout work, this focused approach can be considerably more practical than switching between several unrelated applications.
Conclusion
Scientific figures do not need to become another time-consuming part of the research process. By combining AI-assisted drafting with structured scientific templates and editable outputs, this platform gives researchers a practical way to move from raw study information to a usable figure much faster.
Its strongest appeal is not simply that it can generate images. The real value comes from understanding the types of figures researchers actually need: graphical abstracts, conceptual frameworks, systematic-review diagrams, clinical-trial flows, statistical plots, and biological visualizations.
Researchers should still inspect every generated figure before publication and check the AI policies of their target journal. With that caveat in mind, the platform offers a compelling workflow for anyone who would rather spend their time refining research than fighting with boxes, arrows, alignment tools, and formatting settings.
Frequently Asked Questions (FAQ)
Can I edit AI-generated figures?
Yes. The workflow is designed to let users review and modify generated figures, including editing labels and adjusting layouts before exporting the final result.
What types of scientific figures can I create?
You can create several research-focused visuals, including graphical abstracts, conceptual frameworks, PRISMA and CONSORT diagrams, volcano plots, phylogenetic trees, forest plots, funnel plots, box plots, heatmaps, and other specialized figures.
Can I use the generated figures in academic papers?
Yes, generated figures can be used for academic purposes under the applicable terms. However, you should always verify the scientific accuracy of the figure and check the specific submission requirements of your journal.
Does it support SVG and PNG?
Yes. The platform supports PNG and vector SVG export for applicable tools, making the figures useful for both publication and presentation workflows.
Is there a free option?
Several tools can be tried for free, and some research figure generators are available without signup. Paid plans are available for users who need larger credit allowances and regular generation.
Is it suitable for students?
Yes. Students working on theses, dissertations, systematic reviews, and research projects can use the specialized generators to create conceptual frameworks, flow diagrams, graphical abstracts, and other academic visuals without learning advanced design software.
Should I check an AI-generated figure before submitting it?
Absolutely. AI should be treated as a drafting and production aid, not as the final scientific authority. Check every label, number, relationship, and visual claim against your original research before submitting the figure.
Can generated figures be used commercially?
The paid plans include a commercial-use license according to the current pricing information. Users should review the applicable terms for their specific use case before commercial publication.
AI Charting , AI Diagram Generator , AI Research Tool , Education .
These classifications represent its core capabilities and areas of application. For related tools, explore the linked categories above.

Figwise Alternatives Product

AISEOMate

AI Entity

FlowGPT

Greek Numero…

PrompTessor

Lessie AI

SalaryHow

HostFinder

PatentFig AI