

















Latency Atlas
What is Latency Atlas?
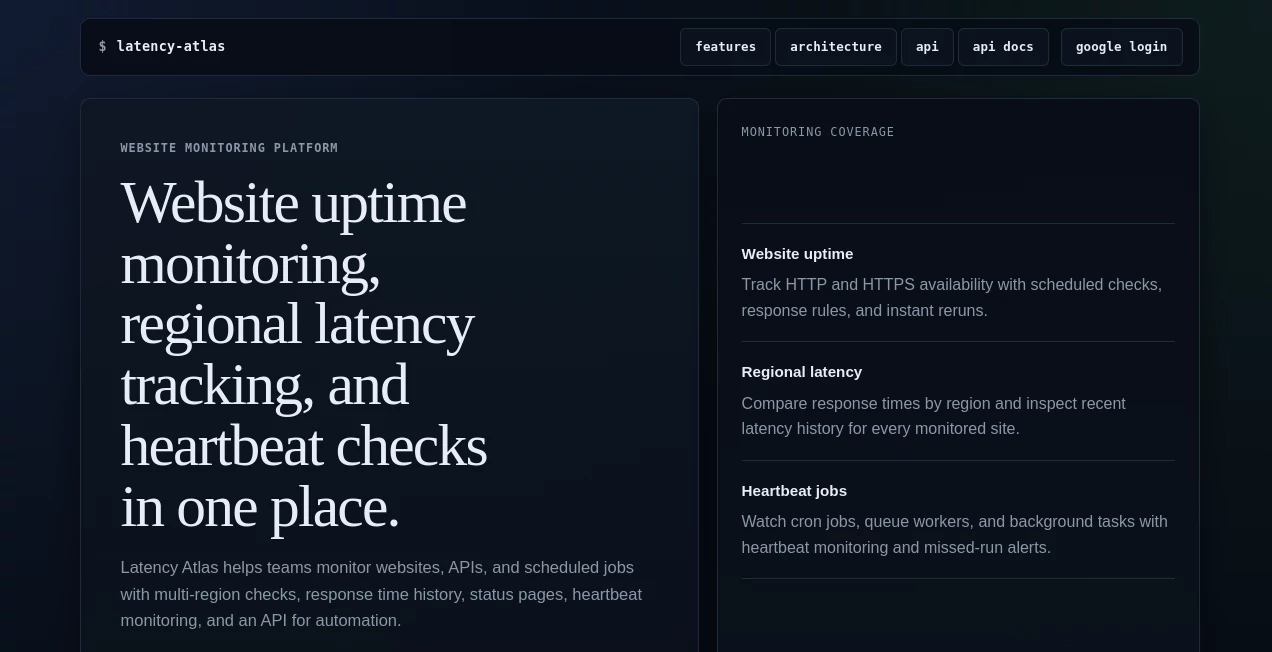
Keeping websites, APIs, and background services available around the clock has become a critical part of modern software development. Even a few seconds of downtime or unexpected latency can impact customer trust, application performance, and business operations. This platform provides a practical monitoring solution that helps development and operations teams stay ahead of potential issues before users notice them.
Instead of focusing only on uptime, the platform combines regional latency monitoring, heartbeat tracking, response history, and automated checks into a single dashboard. Teams can monitor public websites, REST APIs, scheduled jobs, and background workers while receiving clear insights into availability and response performance across multiple geographic locations. This makes troubleshooting faster and gives organizations greater confidence when deploying new releases or scaling infrastructure. :contentReference[oaicite:0]{index=0}
Key Features
User Interface
The dashboard is designed with simplicity in mind. Monitored services are organized in a clean interface where users can quickly review uptime status, response times, historical performance, and recent incidents. Navigation is straightforward, making it suitable for both experienced DevOps engineers and smaller development teams that need reliable monitoring without unnecessary complexity.
Accuracy & Performance
Monitoring requests are executed from multiple regions, allowing teams to compare latency across different locations instead of relying on a single monitoring point. This approach helps identify regional connectivity issues, CDN problems, or routing delays that may not be visible from one location alone. Historical response time data also makes it easier to recognize gradual performance degradation before it becomes a major incident. :contentReference[oaicite:1]{index=1}
Capabilities
- Website uptime monitoring for HTTP and HTTPS endpoints.
- Multi-region latency measurements.
- API endpoint monitoring.
- Heartbeat monitoring for cron jobs and background workers.
- Response time history and performance tracking.
- Status page support.
- Automation through API integration.
- Scheduled monitoring with configurable checks.
- Quick rerun capabilities for validation.
- Suitable for websites, cloud applications, SaaS products, and APIs.
Security & Privacy
The monitoring system is designed to observe service availability without requiring intrusive access to application infrastructure. Teams can monitor endpoints while keeping internal systems isolated. API-based automation also enables integration into existing workflows without disrupting deployment pipelines. :contentReference[oaicite:2]{index=2}
Use Cases
- Monitoring business websites for uptime.
- Tracking REST API availability.
- Observing cloud infrastructure performance.
- Monitoring scheduled jobs and background processes.
- Detecting regional latency issues.
- Supporting DevOps and Site Reliability Engineering workflows.
- Providing public status pages for customers.
- Integrating monitoring into CI/CD automation.
Pros and Cons
Pros
- Easy-to-use monitoring dashboard.
- Regional latency comparisons.
- Heartbeat monitoring for scheduled tasks.
- Historical response time analysis.
- API available for automation.
- Supports both websites and APIs.
- Status page functionality.
Cons
- Advanced enterprise features may require higher-tier plans.
- Focused primarily on monitoring rather than full observability.
- Best suited for internet-accessible services.
Pricing Plans
The platform offers a starter trial for new users, allowing teams to evaluate monitoring capabilities before committing to a paid subscription. Pricing options are designed to scale with different monitoring requirements, from individual projects to larger production environments. Users should visit the official pricing page for the latest plan details and feature availability. :contentReference[oaicite:3]{index=3}
How to Use Latency Atlas
Getting started is straightforward. After creating an account, add the website, API endpoint, or heartbeat job you want to monitor. Configure monitoring intervals and alert preferences, then review latency history and uptime reports through the dashboard. As data accumulates, historical trends help identify recurring performance issues and optimize infrastructure decisions.
Comparison with Similar Tools
Compared with traditional uptime monitoring services, this solution extends beyond simple availability checks by combining regional latency measurements, heartbeat monitoring, response history, and automation APIs within a single platform. While many monitoring products concentrate on availability alone, the additional visibility into geographic response times makes troubleshooting network-related issues significantly easier. It is particularly useful for SaaS providers, development teams, and organizations operating services across multiple regions. :contentReference[oaicite:4]{index=4}
Conclusion
Reliable monitoring is essential for delivering dependable digital services, and this platform offers an effective balance between simplicity and powerful operational insights. From uptime tracking to regional latency analysis and heartbeat monitoring, it provides the information development and operations teams need to detect problems early, maintain service quality, and improve user experience. Whether monitoring a single website or an expanding portfolio of APIs and cloud applications, it delivers valuable visibility that supports proactive infrastructure management.
Frequently Asked Questions (FAQ)
Can it monitor REST APIs?
Yes. API endpoints can be monitored alongside traditional websites.
Does it support monitoring scheduled jobs?
Yes. Heartbeat monitoring helps track cron jobs, workers, and background processes.
Can I compare latency from different regions?
Yes. Multi-region checks provide visibility into response times across different geographic locations.
Is historical performance data available?
Yes. Response time history allows teams to analyze trends and identify recurring performance issues.
Does it provide automation capabilities?
Yes. API access enables integration with deployment pipelines and operational workflows.