


















SolarScope
What is SolarScope?
There's a painful gap in solar development that most professionals know all too well: you spend days gathering data from a dozen different sources — NREL, FEMA flood maps, transmission line databases — before you even know if a site is worth pursuing. That's time, money, and energy burned before a single panel gets designed.
That's exactly the problem this platform was built to solve. It brings together authoritative solar and infrastructure data onto a single interactive map, then layers AI on top to analyze everything in under a minute. The result? A complete site screening workflow that used to take days now takes seconds.
Whether you're a commercial solar developer evaluating a dozen sites a week, an independent consultant advising landowners, or an analyst building a renewable energy portfolio, this tool changes how fast — and how confidently — you can make decisions.
Key Features
User Interface
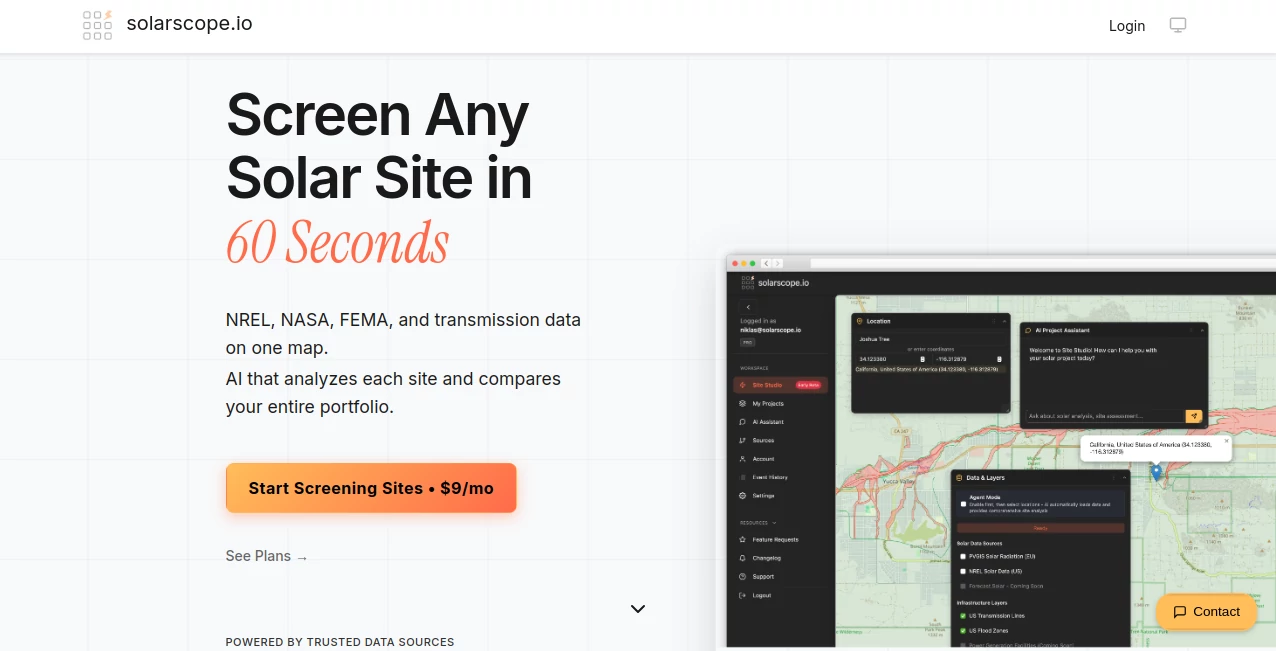
The whole experience is built around a map-first philosophy. You open Site Studio, drop a pin at your target location, and the interface becomes your visual command center. Layers toggle on and off cleanly — solar irradiance, flood zones, transmission lines, grid hosting capacity — all sitting right on top of your map without needing to open a second tab or a separate dashboard.
It's the kind of interface that feels obvious once you've used it. No onboarding maze, no complex menus to navigate. A new user can go from sign-in to their first full site analysis in minutes. For professionals juggling multiple projects, that low friction matters enormously.
Accuracy & Performance
The data backbone here is genuinely impressive. Solar irradiance comes from NREL and NASA POWER — two of the most respected sources in the industry. Flood risk data pulls from FEMA. Grid and transmission information comes from HIFLD (Homeland Infrastructure Foundation-Level Data). European and global coverage is handled through PVGIS and ArcGIS.
This isn't scraped or approximated data. It's the same authoritative sources that large engineering firms pay thousands of dollars per year to access through legacy platforms. The platform aggregates all of it automatically, so you're not doing manual lookups across government portals.
Performance is fast. Data layers load in seconds. The AI analysis completes in under a minute. Users who previously spent two to three days on preliminary site research report completing the equivalent work in under an hour.
Capabilities
The platform's capabilities fall into two main areas: individual site analysis through Site Studio, and portfolio-level intelligence through the AI Portfolio Insights feature.
In Site Studio, you work through five steps: pin your location, layer your data, run AI analysis, chat with the AI assistant for deeper questions, and save your project. Each step flows naturally into the next. The AI Project Assistant can answer specific questions — annual solar potential, ROI estimates, system sizing, flood risk detail — with full awareness of your selected location and loaded data layers. It's not a generic chatbot. It knows your site.
The Portfolio Analysis feature is where things get particularly powerful for developers with multiple projects in progress. You can compare every site you've assessed in a single conversation with the AI. Ask it to rank your pipeline by opportunity. Ask it where your data gaps are. Ask it which site has the best grid interconnection prospects. The AI synthesizes across your entire portfolio and gives you actionable direction.
Security & Privacy
The platform is operated by Lissjos Engineering LLC, based in San Diego, CA. It uses Stripe for payment processing — a widely trusted, PCI-compliant payments infrastructure. User data is governed by a published Privacy Policy and Terms of Service available on the site. Projects and AI conversation history are saved to user accounts with persistence across sessions, so your analysis is there when you come back to it.
Use Cases
The practical applications span a surprisingly wide range of solar professionals:
- Commercial and utility-scale developers can screen many potential sites rapidly before committing engineering resources to any of them. The flood risk and grid feasibility data alone can eliminate unviable sites in seconds.
- Solar consultants and advisors working with landowners or investors can quickly generate site assessments that communicate solar potential, constraints, and infrastructure context in a format clients can understand.
- Energy analysts building or managing a renewable project pipeline can use the portfolio comparison feature to prioritize which sites deserve deeper engineering investment.
- Property owners and real estate developers considering solar installations on commercial or agricultural land can get a credible first-pass analysis without hiring an engineering firm for a preliminary feasibility study.
- Municipalities and public agencies evaluating solar on government-owned parcels can use the tool to shortlist viable locations quickly before issuing RFPs or engaging consultants.
One scenario worth highlighting: imagine you're evaluating land parcels in the Southwest US as potential sites for a ground-mount solar project. Instead of manually querying NREL's PVWatts, checking FEMA's flood map portal, then calling the utility to ask about hosting capacity — you do all of that on one map, in one session, with an AI that synthesizes the data and tells you what it means for your project.
Pros and Cons
- Pro: Dramatically faster site screening — from days to minutes for the same scope of preliminary analysis.
- Pro: Trusted data sources (NREL, NASA, FEMA, HIFLD) aggregated automatically, no manual lookups.
- Pro: AI that understands your specific site context, not a generic assistant.
- Pro: Portfolio-level AI analysis that works across all your saved projects simultaneously.
- Pro: Pricing that's accessible — starting at $9/month compared to competitor platforms charging $1,200–$2,500/user/month.
- Pro: Global solar irradiance coverage with deeper infrastructure data for the US market.
- Pro: No contracts, cancel anytime.
- Con: The deepest data layers (grid hosting capacity, FEMA flood zones, HIFLD transmission) are currently US-focused. International users get solar irradiance data but less infrastructure detail.
- Con: Not a full engineering design tool — it's explicitly positioned as a screening tool for the decision before detailed design work begins. Teams needing panel-level layout and energy production modeling will still need a separate design platform downstream.
- Con: No free tier currently available; the entry plan starts at $9/month.
Pricing Plans
Pricing is structured around three tiers, all billed monthly with no contracts:
- Scout — $9/month (or $7/month billed annually): 10 site assessments per month, 5 saved projects, NREL solar data for the US, US flood zones, AI Project Assistant, AI Portfolio Insights for up to 5 projects, and standard support. A solid entry point for analysts or developers with a focused site pipeline.
- Pro — $29/month (or $22/month billed annually): Unlimited site assessments, unlimited saved projects, all data sources including NREL, PVGIS, and ArcGIS, all infrastructure layers, AI Project Assistant, full AI Portfolio Insights, PDF export, and priority support. This is the plan most active developers will find fits their workflow.
- Scale — $99/month (or $79/month billed annually): Everything in Pro, plus batch site analysis, early access to new features, and dedicated support. Designed for high-volume users managing large pipelines or teams doing frequent assessments.
The annual billing option saves 22% across all tiers. All plans can be upgraded, downgraded, or cancelled at any time from account settings.
How to Use This Tool
Getting started is genuinely fast. Here's how the workflow runs in practice:
- Step 1 — Open Site Studio and navigate the map. Enter an address or coordinates to pin your target site. The map is your starting point and workspace.
- Step 2 — Toggle your data layers. Turn on solar radiation data, transmission lines, flood zones, or any combination of the available infrastructure layers. Everything overlays on the same map instantly.
- Step 3 — Run AI Analysis. With your layers selected, the AI Project Assistant automatically generates a comprehensive site assessment — solar potential, flood risk evaluation, transmission line analysis, grid feasibility — all grounded in the real data you loaded.
- Step 4 — Ask follow-up questions. Use the chat interface to go deeper. Ask about annual energy output, ROI projections, system sizing recommendations, or specific constraints. The AI has full context of your location and loaded data.
- Step 5 — Save your project. Your project is saved with all map data, analysis results, and AI conversation history. Come back to it anytime and pick up exactly where you left off.
For portfolio work, navigate to the Portfolio Analysis feature and ask the AI to compare and rank your saved projects. It will analyze across your entire pipeline and surface the most actionable insights.
Comparison with Similar Tools
The honest comparison here is important because this tool isn't competing in the same category as every platform it gets compared to.
Tools like Aurora Solar and HelioScope are engineering design platforms. They're excellent at detailed panel-level system design, production modeling, and proposal generation — but that work happens after you've already decided a site is worth pursuing. They're also priced accordingly, with Aurora running $135–$220 per user per month and HelioScope at $95–$259 per user per month.
PVcase Prospect and Glint Solar are closer comparisons — both map-based tools aimed at utility-scale site screening. PVcase in particular targets the enterprise market, with pricing typically in the $1,200–$2,500 per user per month range and a learning curve that takes days to weeks to overcome. Users have also reported performance issues including crashes.
RatedPower is a full design pipeline tool for large utility-scale projects — powerful, but oriented toward the design and engineering phase rather than rapid early-stage screening.
What differentiates this platform is the combination of: genuinely fast setup (minutes, not days), AI that automatically analyzes every site without manual prompting, flat predictable pricing accessible to smaller teams and individual developers, and a workflow explicitly optimized for the screening decision — before you spend thousands on engineering software and full feasibility studies.
For teams that need a fast, affordable, data-driven way to decide which sites deserve deeper investment, there's a clear gap in the market that this tool fills better than any of the alternatives at its price point.
Conclusion
Solar site development has always front-loaded a lot of the hard work into the phase where you know the least — preliminary screening. Developers have historically had two options: pay for expensive enterprise software, or spend days doing manual research across fragmented data sources. Neither is a great answer, especially for smaller teams or consultants who need to move fast.
This platform genuinely changes that equation. It brings together the data that matters — irradiance, flood risk, grid capacity, transmission infrastructure — and uses AI to turn that data into actionable insights in under a minute. The pricing removes the accessibility barrier that has historically kept powerful solar analysis tools locked inside large enterprises.
If you're in the business of evaluating solar sites, whether you're screening one site a month or fifty, this is the kind of tool that pays for itself the first time it saves you a few hours of research — or steers you away from a site that looked promising until the flood zone data told a different story.
Frequently Asked Questions (FAQ)
- Is there a free plan available? There is currently no free tier. The Scout plan starts at $9/month and provides full access to site screening features across supported US states.
- What data sources are used for site analysis? The platform draws from NREL, NASA POWER, FEMA, HIFLD, PVGIS, and ArcGIS — depending on the location and data layer. US users get the fullest coverage including grid hosting capacity, flood zones, and transmission lines.
- How long does a site analysis take? Data layers load in seconds. The AI assistant delivers a complete automated analysis — covering solar potential, flood risk, grid feasibility, and infrastructure — in under a minute.
- Does it work for international sites? Global solar irradiance data is available worldwide through PVGIS and ArcGIS. Deeper infrastructure layers like grid hosting capacity and FEMA flood zones are currently US-focused. More regional data is being added over time.
- Is this a replacement for Aurora Solar or HelioScope? No — and it's not trying to be. Those tools are for detailed system design. This platform is for the screening phase that comes before design: evaluating whether a site is worth pursuing in the first place. The two types of tools complement each other.
- Can I cancel my subscription anytime? Yes. All plans are month-to-month with no contracts. You can upgrade, downgrade, or cancel from your account settings at any time with no cancellation fees.
- What is the Portfolio Analysis feature? It's an AI feature that works across all your saved projects simultaneously. You can ask it to rank your pipeline by opportunity, identify missing data, or compare sites on any dimension — and get answers grounded in real data from every project in your account.
- What does the PDF export include? PDF export is available on Pro and Scale plans and lets you download your site analysis as a shareable document — useful for client presentations, internal reviews, or investment conversations.
AI Productivity Tools , AI Research Tool , AI Analytics Assistant , AI Maps Generator .
These classifications represent its core capabilities and areas of application. For related tools, explore the linked categories above.

SolarScope Alternatives Product

GPT Image 2 …

IntoTheBlock

Remove My Me…

eesel AI

Fina Money

Ovulation Ca…

Sorank

AyeWatch AI

Weekly Brief