


















FigEditor
What is FigEditor?
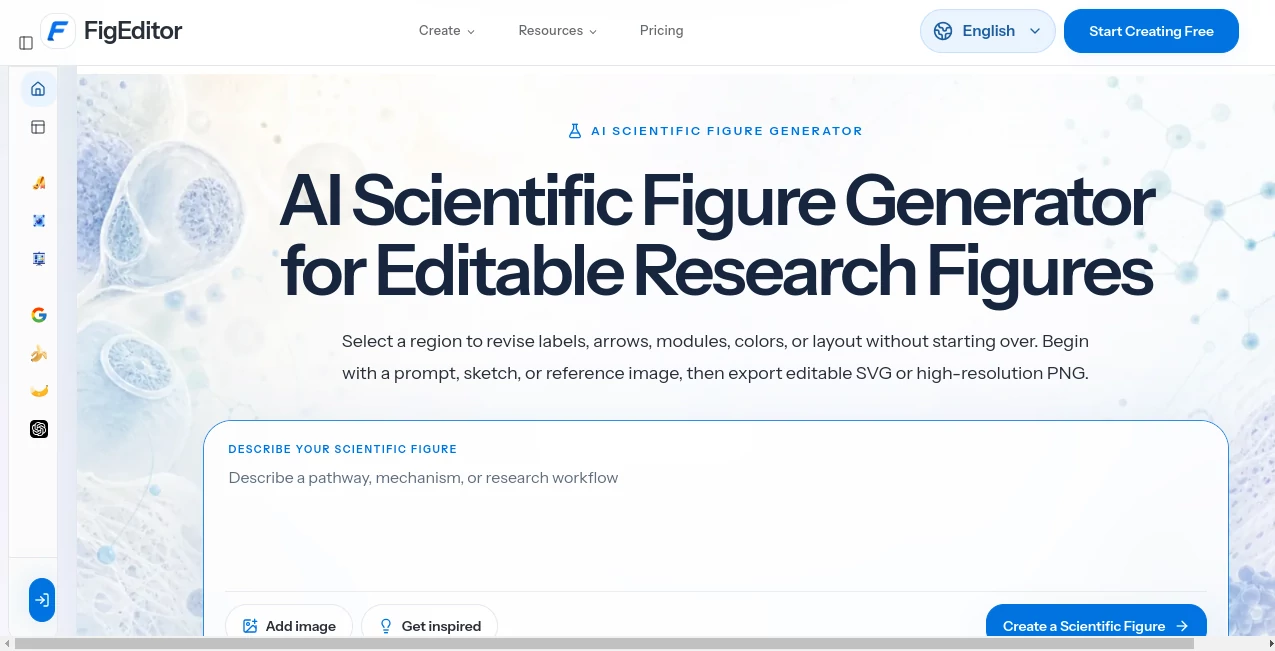
Creating a clear scientific figure can take far longer than expected. Researchers often have the idea, the data, and even a rough sketch ready, but turning that material into a polished visual for a paper, poster, or presentation can become a separate design project. FigEditor brings that process into a browser-based workspace designed specifically around scientific communication.
The platform can start with a written description, a hand-drawn sketch, or a reference image and turn that input into a structured scientific figure. Instead of treating the generated result as a finished image that cannot be changed, it gives researchers room to revise labels, arrows, modules, colors, and layouts before exporting the final work.
This makes the workflow particularly useful for researchers who need to create several iterations of a figure. A mechanism can be adjusted, a workflow can be reorganized, or a label can be corrected without rebuilding the entire visual from scratch.
Key Features
- Generate scientific figures from text prompts
- Turn rough sketches into polished research visuals
- Use reference images to guide composition and visual direction
- Revise selected regions without recreating the entire figure
- Edit labels, arrows, modules, colors, and layouts
- Convert existing PNG and JPG figures into scalable vector assets
- Export editable SVG files
- Export high-resolution PNG images
- Create scientific illustrations, flowcharts, and graphical abstracts
- Support workflows across life science, AI, engineering, environmental research, energy, and materials
- Work with multiple image generation models
- Provide watermark-free downloads on paid plans
- Offer generation up to 4K on supported models
User Interface
The interface is built around a straightforward research workflow rather than a traditional graphic-design environment. Users can begin by describing what they want, uploading an early sketch, or providing a reference image. From there, the generated figure can be refined within the same workspace.
This approach is especially convenient for researchers who are comfortable explaining their scientific ideas but do not want to spend hours learning professional illustration software. The workflow keeps the focus on the research concept while still allowing important visual details to be adjusted.
Accuracy & Performance
For scientific work, visual quality alone is not enough. A figure has to communicate the intended mechanism, relationship, process, or workflow correctly. The platform is designed to produce a structured first draft that researchers can review and refine before using it in academic material.
The ability to edit labels, shapes, arrows, colors, and layouts is valuable here because AI-generated figures should still be checked against the underlying research. The final scientific interpretation remains the responsibility of the researcher, while the tool helps reduce the manual design work involved in presenting that information.
Capabilities
The platform covers several common research-visualization workflows. A researcher can describe a mechanism or experimental process and generate a first figure from text. Someone working from a notebook or whiteboard can upload a rough sketch and turn it into a cleaner version. A reference image can also be supplied when the desired composition, palette, or visual density needs to follow a particular direction.
Another useful capability is figure vectorization. Existing PNG or JPG scientific figures can be converted into scalable vector assets, making it easier to modify labels, colors, and layouts later in a design or presentation application.
The service also includes specialized creation tools and several image models, giving users different ways to approach scientific illustration depending on the type of visual they need.
Security & Privacy
Scientific projects can contain unpublished research, manuscript material, experimental concepts, and other information that researchers may want to handle carefully. The platform provides dedicated information covering questions about uploaded material, prompts, papers, generated output, data handling, and training use.
Researchers should still review the current privacy policy and terms before uploading confidential or unpublished material, particularly when working with research that is subject to institutional, contractual, or publication-specific requirements.
Use Cases
Research Papers: Create scientific figures that explain mechanisms, processes, structures, and workflows for journal manuscripts.
Graphical Abstracts: Turn a complex research concept into a more accessible visual summary that can communicate the main idea quickly.
Scientific Posters: Develop supporting visuals for conferences and academic presentations without having to create every graphic manually.
Workflow Diagrams: Build organized diagrams showing stages, relationships, processes, or system architectures.
Mechanism Illustrations: Present biological, chemical, engineering, or other scientific mechanisms in a visual format.
Sketch Refinement: Transform an early hand-drawn concept into a cleaner figure while preserving the core logic of the original idea.
Existing Figure Editing: Vectorize a flat image so that elements such as labels, colors, and layout can be modified more easily.
Pros and Cons
- Pros: Designed specifically for scientific figures
- Pros: Supports text, sketches, and reference images as starting points
- Pros: Allows targeted revisions instead of requiring complete regeneration
- Pros: Supports editable SVG export
- Pros: Offers high-resolution PNG export
- Pros: Includes several creation tools and image models
- Pros: Useful across multiple research disciplines
- Cons: AI-generated scientific content still needs human scientific review
- Cons: Some advanced commercial-use benefits are tied to paid plans
- Cons: Researchers working with highly sensitive unpublished material should review the service's data-handling terms before uploading it
Pricing Plans
The service uses a credit-based pricing model with monthly, yearly, and pay-as-you-go options. A free-credit option is available for users who want to try the workflow before committing to a subscription.
The Basic plan is listed at $19 monthly or $114 annually, with the annual option shown at a 50% saving. The plan includes 5,040 credits per year on the annual subscription and is positioned for individual researchers.
The Plus plan is listed at $39 monthly or $234 annually. Its annual allowance is 12,960 credits, making it better suited to researchers who expect more iterations and higher usage.
The Enterprise plan is listed at $69 monthly or $414 annually. It provides 28,800 credits per year on the annual subscription and is intended for higher-volume use and teams.
Paid plans include watermark-free downloads, while generation up to 4K is available on supported models. Commercial licensing is included with the yearly Basic plan and the Plus and Enterprise plans.
How to Use It
Start by deciding what the figure needs to communicate. Describe the mechanism, workflow, experiment, structure, or relationship you want to show. A detailed prompt can help establish the important elements and connections.
If you already have a rough drawing, upload the sketch instead. This is useful when the scientific logic is already mapped out on paper but the visual needs refinement.
You can also provide a reference image when you have a preferred composition, palette, or level of visual detail. After generation, review the scientific content carefully and make any necessary changes to labels, shapes, arrows, colors, or layout.
Once the figure is ready, export it as an editable SVG or a high-resolution PNG for use in a manuscript, poster, presentation, or other research material.
Comparison with Similar Tools
General-purpose image generators can produce attractive visuals, but they are not always built around the specific requirements of academic figures. Scientific diagrams frequently depend on accurate labels, directional arrows, structured relationships, and layouts that need to survive several rounds of revision.
This platform takes a more focused approach. Instead of stopping at image generation, it combines generation with editing and vectorization. That makes it particularly appealing when the goal is not simply to create an illustration, but to develop a research figure that can continue evolving alongside a manuscript or presentation.
Its ability to work from text, sketches, and references also gives researchers more flexibility than a workflow that starts exclusively from a written prompt.
Conclusion
For researchers who regularly spend too much time turning scientific ideas into publication-ready visuals, this platform offers a practical alternative to building every figure manually. Its strongest advantage is the combination of generation and editability: users can start with an idea, sketch, or reference and continue refining the result instead of treating the first AI output as final.
The support for editable SVG files, high-resolution PNG exports, figure vectorization, and multiple scientific visualization workflows makes it useful beyond simple image creation. Whether the goal is a graphical abstract, workflow diagram, mechanism illustration, poster visual, or supporting figure for a paper, it can shorten the distance between a research concept and a polished visual.
Frequently Asked Questions (FAQ)
What is an AI scientific figure generator?
It is a tool that uses AI to turn a text prompt, sketch, or reference image into a visual draft designed for scientific communication. The resulting figure can then be reviewed and refined before export.
Can I create a figure from a hand-drawn sketch?
Yes. You can upload a rough sketch, structure draft, or early layout and use it as the starting point for a more polished scientific figure.
Can I edit an AI-generated scientific figure?
Yes. Selected areas can be revised, including labels, arrows, modules, colors, and layout, allowing you to make changes without rebuilding the entire figure.
Can I export scientific figures as SVG?
Yes. Editable SVG export is supported, along with high-resolution PNG export for papers, posters, and presentations.
Can existing PNG or JPG figures be edited?
Existing raster figures can be vectorized into scalable vector assets, making it possible to update elements such as labels, colors, and layout more easily.
Should I verify an AI-generated scientific figure?
Yes. AI-generated visuals should always be checked against the underlying research. Labels, relationships, mechanisms, arrows, and other scientific details should be reviewed before publication or formal presentation.
Does the service offer a free option?
The service provides free credits so users can try the workflow. Paid plans are available for researchers who need additional credits and features.
Does it support high-resolution output?
Yes. High-resolution PNG export is available, and generation up to 4K is supported on compatible models.
AI Diagram Generator , AI Illustration Generator , AI Presentation Generator , AI Graphic Design .
These classifications represent its core capabilities and areas of application. For related tools, explore the linked categories above.

FigEditor Alternatives Product

Mage

Manus

MyMap.AI

SparkIconAI

Claude Desig…
volume shader

Logo Teddy

Freepik

Fig0
