


















Mappt
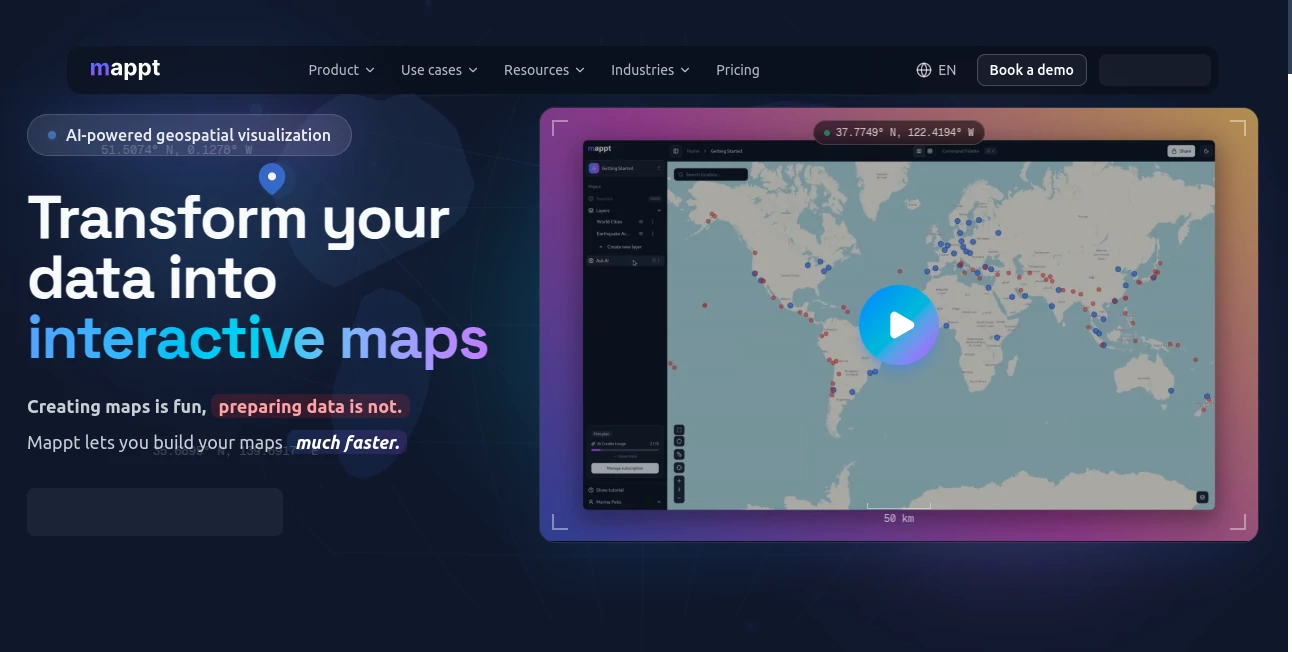
What is Mappt?
Mappt is an AI-powered geospatial visualization platform that helps users transform raw data into interactive maps without requiring advanced GIS knowledge. Instead of spending hours cleaning datasets, preparing coordinates, and manually designing visual layers, users can upload files, connect data sources, or provide information directly and create meaningful maps in a much shorter time.
The platform is designed for analysts, researchers, businesses, journalists, and teams that need to understand location-based information visually. Whether you want to display population trends, analyze business locations, explore geographic patterns, or present research findings, this solution makes complex mapping workflows much easier and more accessible.
Key Features
- AI-Powered Map Creation: Automatically analyzes uploaded data and creates suitable map visualizations with smart styling.
- Multiple Data Sources: Supports formats such as CSV, Excel, GeoJSON, public datasets, APIs, and database connections.
- Interactive Map Layers: Build detailed maps using points, heatmaps, regional visualizations, and 3D data representations.
- Spatial Analysis Tools: Explore geographic patterns, filter regions, and analyze individual data points.
- Shareable Map Views: Publish interactive maps that others can explore without needing an account.
- Export Options: Download maps and data layers in useful formats for further analysis.
- Advanced Styling: Customize symbols, colors, gradients, visibility, and map appearance.
User Interface
The interface focuses on simplicity and accessibility. Users do not need previous experience with professional mapping software to create attractive visualizations. The workflow feels familiar: upload data, allow the AI system to understand the information, adjust the design if needed, and share the final result.
The clean workspace makes it easier to focus on insights instead of technical preparation. This is especially valuable for teams that need professional-looking maps but do not have dedicated GIS specialists.
Accuracy & Performance
The platform is built to reduce the manual effort involved in geographic visualization. Its AI-assisted workflow helps identify geographic fields, recommend appropriate visualization methods, and organize information into readable layers.
While users remain in control of the final output, the automated suggestions speed up the process and help transform complex datasets into understandable visual stories.
Capabilities
From simple location markers to advanced geographic analysis, the platform provides tools for creating different types of interactive maps. Users can combine multiple layers, display regional comparisons, create density visualizations, and add charts connected to map data.
Businesses can use it to understand market locations, researchers can visualize collected information, and organizations can communicate geographic trends through engaging interactive experiences.
Security & Privacy
Data management is an important part of any visualization workflow. The platform provides features designed for responsible data handling while allowing users to control their projects, shared views, and exported information.
Users maintain ownership of the data they work with and can decide how their created maps are shared with others.
Use Cases
- Business Analytics: Visualize customer locations, store networks, sales regions, and market opportunities.
- Research Projects: Present geographic studies and location-based findings in an interactive format.
- Journalism: Create engaging data-driven stories using maps instead of static charts.
- Urban Planning: Explore population patterns, infrastructure information, and regional changes.
- Education: Help students and researchers understand geographic concepts through visual learning.
- Operations: Analyze logistics, service areas, and location-based performance.
Pros and Cons
Pros
- Easy map creation without advanced GIS skills
- AI assistance reduces preparation time
- Supports multiple data formats and sources
- Interactive and shareable visualizations
- Flexible layer management and customization
Cons
- Advanced GIS professionals may require more specialized features
- Large and highly complex datasets may need additional preparation
- Some advanced features are available only on paid plans
Pricing Plans
The platform offers multiple pricing options to support different types of users. A free plan is available for users who want to explore the core experience and create initial projects.
- Free: Includes limited AI credits, projects, layers, and shared views for getting started.
- Starter: Designed for individuals who need more projects, AI credits, and additional data capabilities.
- Pro: Suitable for professionals requiring more advanced projects, layers, shared views, and database connections.
- Custom: Built for organizations that need larger-scale usage and customized solutions.
How to Use Mappt
- Create an account and access the mapping workspace.
- Upload a dataset, connect a supported source, or provide geographic information.
- Let the AI system analyze your data and generate a suitable map structure.
- Customize layers, styles, charts, and interactive elements.
- Share your map publicly or export your data for additional workflows.
Comparison with Similar Tools
Traditional mapping platforms often require technical knowledge, manual data preparation, and experience with geographic information systems. This solution focuses on simplifying that process by combining automation with interactive visualization.
Compared with standard charting tools, it provides deeper geographic context. Compared with professional GIS software, it offers a more approachable experience for users who need powerful results without a complicated learning curve.
Conclusion
Creating professional interactive maps does not have to be a complicated process. This AI-powered mapping platform gives individuals and teams a faster way to turn location-based data into clear, engaging visual experiences.
With automated assistance, flexible visualization options, and simple sharing features, it is a valuable choice for anyone who wants to discover patterns, communicate insights, and make better decisions using geographic data.
Frequently Asked Questions (FAQ)
What type of data can I use?
Users can work with various data formats including CSV, Excel, GeoJSON, public datasets, APIs, and supported database sources.
Do I need GIS experience?
No. The platform is designed for users who want to create interactive maps without needing professional GIS training.
Can I share maps with other people?
Yes. Users can create shareable interactive views that others can explore through a link.
Can I export my created maps and data?
Yes. Export options allow users to download map views and data layers for additional analysis or presentation.
Is there a free plan available?
Yes. A free option is available for users who want to test the platform and create initial projects.
AI Data Mining , AI Productivity Tools , AI Research Tool , AI Maps Generator .
These classifications represent its core capabilities and areas of application. For related tools, explore the linked categories above.

Mappt Alternatives Product

WhatsMyName …

GEO Checker

Techvorizon …

SkipBait

Metal

RankPeak

AI Entity

Zush

DiRe-RAPIDS
