


















Scientific Figure
What is Scientific Figure?
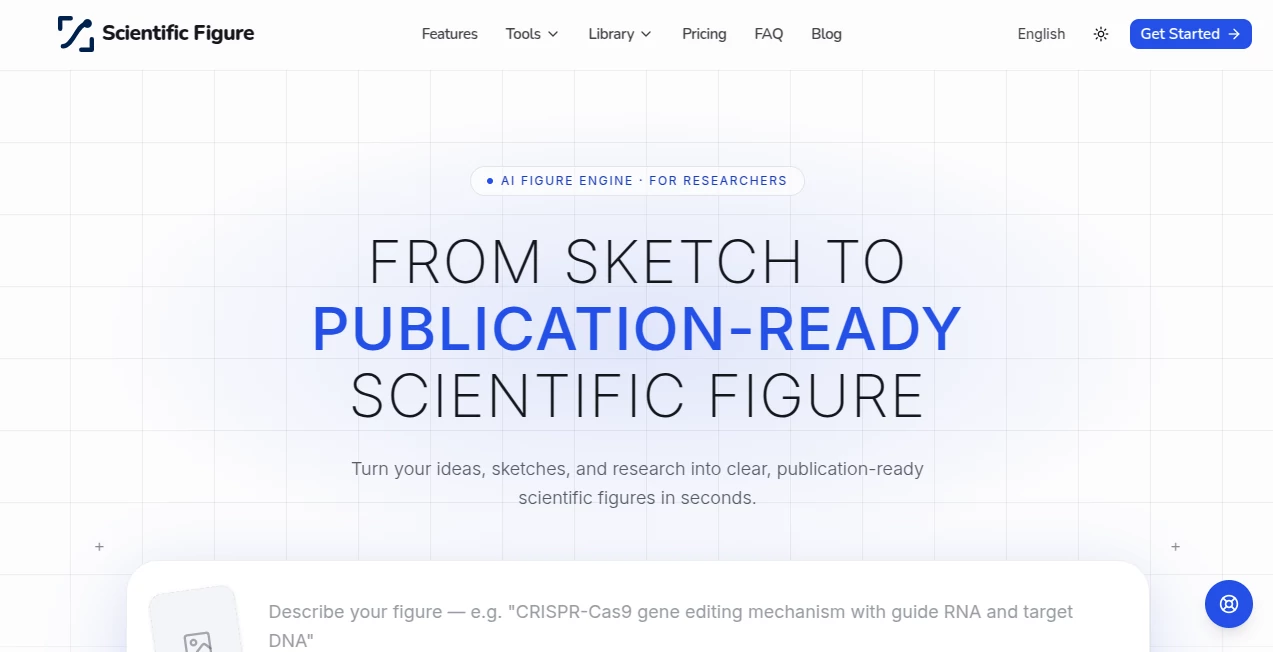
Scientific researchers often have the data, ideas, and results they need, but turning those materials into a clear figure can take surprisingly long. Scientific Figure is designed to shorten that process by turning research material, sketches, descriptions, and papers into publication-ready scientific visuals.
The platform focuses specifically on research-oriented graphics rather than general-purpose image generation. A researcher can start with a sentence, an abstract, an existing image, a rough whiteboard sketch, or even a paper, then use AI to create a figure suitable for a manuscript, presentation, or conference poster.
What makes the workflow particularly practical is that the result is not simply treated as a finished picture. Labels, colors, backgrounds, and individual regions can remain editable, giving researchers more control when a figure needs to match a journal's requirements or a last-minute correction is necessary.
Key Features
- Text-to-figure generation from sentences, research descriptions, and abstracts.
- Image-to-figure conversion for sketches, photographs, and existing figures.
- Reference-to-figure generation using research papers as source material.
- Scientific illustrations with multiple visual styles, ranging from clean schematics to 3D renders.
- Graphical abstract creation with layouts designed to present a research problem, method, and result in one panel.
- Conference poster generation with academic layouts and common poster dimensions.
- Editable labels, legends, callouts, colors, and figure regions.
- Export options including PNG, JPG, SVG, and PPTX.
- High-resolution output for publication and presentation workflows.
- Specialized generators for diagrams, workflows, pathways, and other research visuals.
User Interface
The interface is built around a straightforward idea: start with the material you already have and turn it into a figure. Instead of requiring researchers to build every element manually, the workflow lets them provide text, an image, a sketch, or a reference document and then refine the generated result.
This approach can be especially useful for researchers who understand their subject extremely well but do not have much experience with professional illustration software. The editing tools also make practical corrections easier. For example, changing a label or adjusting a color palette does not necessarily require recreating the entire figure.
Accuracy & Performance
Scientific figures need more than attractive visuals. They need to communicate relationships, processes, structures, and experimental ideas clearly. The platform is built around research-specific figure generation, including mechanisms, signaling pathways, experimental workflows, graphical abstracts, and other scientific diagrams.
Researchers should still review every generated figure carefully before publication. AI-generated scientific artwork can assist with visual communication, but it should not replace the author's responsibility for checking labels, numbers, relationships, terminology, and scientific meaning.
For higher-quality output, the service supports resolutions reaching up to 8K on eligible plans. Graphical abstracts can also be produced at high resolution suitable for journal submission workflows.
Capabilities
The platform goes beyond a basic prompt-to-image generator. Its dedicated tools cover several common academic design tasks. Researchers can create scientific illustrations, graphical abstracts, conference posters, visual abstracts, circuit diagrams, PRISMA flow diagrams, cladograms, and phylogenetic trees.
The editing system is another important part of the workflow. Text remains editable, individual regions can be redrawn, colors can be adjusted, and backgrounds can be removed or made transparent. This is useful when a figure needs to follow a particular journal palette or fit an existing manuscript template.
Export flexibility is also well considered. PNG and JPG work well for conventional image workflows, while SVG keeps shapes and text as vectors. PPTX export is particularly convenient for researchers preparing presentations because elements can be adjusted later in PowerPoint or compatible presentation software.
Security & Privacy
Research materials can contain unpublished findings, experimental information, or work that is still under review. For that reason, researchers should always consider the privacy and data-handling policies of any online AI service before uploading sensitive material.
The service provides dedicated privacy and legal documentation, while payment processing is handled through an encrypted checkout using Stripe. Users working with confidential or unpublished research should review the applicable privacy terms and acceptable-use policies before submitting sensitive documents or data.
Use Cases
Research papers: Authors can create mechanism diagrams, experimental workflows, figure panels, and graphical abstracts to make complex research easier to understand.
Conference presentations: Editable visuals and PPTX export make the platform useful when figures need to move from a research workflow into a presentation.
Scientific posters: Researchers can generate complete conference poster layouts in A0, A1, and 48×36-inch formats, with portrait and landscape options.
Graphical abstracts: A complicated study can be condensed into a one-panel visual showing the problem, method, and result in a format designed for journal submission.
Biology and life sciences: Mechanisms, signaling pathways, biological processes, phylogenetic trees, and other specialized visuals can be produced through dedicated workflows.
Early-stage research ideas: A rough sketch or whiteboard drawing can become a cleaner visual starting point, which can then be reviewed and refined by the researcher.
Pros and Cons
- Pros: Designed specifically around scientific and academic figures.
- Pros: Supports text, image, sketch, and paper-based inputs.
- Pros: Editable labels, colors, backgrounds, and regions make revisions easier.
- Pros: SVG and PPTX exports are useful for professional editing workflows.
- Pros: Includes dedicated tools for posters, graphical abstracts, diagrams, and scientific illustrations.
- Pros: A free starting allowance of 50 credits is available without requiring a credit card.
- Cons: Generated scientific content still needs careful human verification before publication.
- Cons: Larger research workflows may require a paid subscription for additional credits and higher-resolution exports.
Pricing Plans
The service offers a free starting option with 50 credits and no credit card requirement. This gives researchers an opportunity to test the generation workflow before committing to a subscription.
The Pro plan is listed at $10 per month when billed yearly and includes 3,000 credits per month, approximately 70 figures, exports up to 4K, no watermarks, and publication authorization.
The Plus plan costs $20 per month with annual billing and provides 7,000 monthly credits, approximately 160 figures, higher export capabilities, no watermarks, publication authorization, and a higher-priority generation queue.
The Max plan is priced at $40 per month with annual billing and is aimed at laboratories and teams. It provides 15,000 credits per month, approximately 350 figures, up to 8K export, no watermarks, publication authorization, and the highest-priority queue.
Paid plans also provide access to advanced generation models, including FLUX, Seedream, GPT, and Nano Banana.
How to Use the Tool
- Open the figure generation workspace and choose the type of scientific visual you want to create.
- Start with a research description, abstract, sketch, existing image, or reference paper depending on the workflow.
- Describe the scientific concept and the visual relationships that should appear in the figure.
- Generate the initial figure and review its scientific content carefully.
- Edit labels, legends, colors, backgrounds, or individual regions where necessary.
- Adjust the visual style or journal-oriented color palette when required.
- Choose the appropriate export format for your next step, such as PNG, JPG, SVG, or PPTX.
- Perform a final scientific and editorial review before using the figure in a manuscript, poster, or presentation.
Comparison with Similar Tools
Traditional scientific illustration software provides extensive control, but it can require considerable design experience and manual work. General AI image generators are faster for creating visuals, yet they are not necessarily designed around scientific diagrams, editable labels, journal workflows, or academic poster formats.
This platform occupies a useful middle ground. It combines AI-assisted generation with research-focused templates and editing capabilities. Compared with starting every figure from a blank canvas, the workflow can save substantial preparation time. Compared with a general image generator, the dedicated scientific tools make it easier to work on common academic formats such as graphical abstracts, research posters, flow diagrams, and scientific illustrations.
The biggest advantage is therefore not simply image generation. It is the combination of generation, editing, specialized scientific workflows, and export formats in one environment.
Conclusion
Creating a good scientific figure can be one of those tasks that consumes hours without actually advancing the research itself. A tool built specifically for this job can make that part of the process considerably easier.
With support for sketches, text, research papers, scientific illustrations, graphical abstracts, posters, specialized diagrams, editable elements, and professional export formats, this platform offers a practical workflow for researchers who need polished visuals without building every component from scratch.
It is best viewed as a design and communication assistant rather than a replacement for scientific judgment. When researchers verify the generated content and make the necessary revisions, it can become a valuable part of the process of turning complex research into visuals that are easier to read, present, and publish.
Frequently Asked Questions (FAQ)
Is there a free option?
Yes. New users can start with 50 free credits without entering a credit card.
Can I create a scientific figure from text?
Yes. The text-to-figure workflow can turn a sentence or research abstract into a scientific visual.
Can I upload an existing sketch?
Yes. Image-to-figure generation can work from photographs, whiteboard sketches, and existing figures to create a cleaner editable version.
Can I create graphical abstracts?
Yes. Dedicated graphical abstract layouts are available for presenting a research problem, method, and result in a single panel.
Can I create scientific posters?
Yes. The poster maker supports A0, A1, and 48×36-inch formats in portrait or landscape orientations, with editable PPTX output.
Can generated figures be edited?
Yes. Labels, legends, callouts, colors, backgrounds, and selected regions can be modified after generation.
Does it support vector export?
Yes. SVG export keeps text and graphical elements as vectors, making the output suitable for further editing in applications such as Illustrator or Inkscape.
Can the figures be used for journal submissions?
Paid plans include publication authorization, while researchers should still review the requirements of their target journal before submission.
Is the tool suitable for conference presentations?
Yes. PPTX export and editable visual elements make it useful for preparing figures and posters for academic presentations.
Should AI-generated scientific figures be checked before publication?
Absolutely. Researchers should verify every label, number, relationship, scientific claim, and visual representation before including an AI-generated figure in published work.
AI Diagram Generator , AI Illustration Generator , AI Presentation Generator , AI Graphic Design .
These classifications represent its core capabilities and areas of application. For related tools, explore the linked categories above.
Scientific Figure details
Website unavailable — View Alternatives
Pricing
- Free
Apps
- Web App
Categories

Scientific Figure Alternatives Product

YoFont
AI Diagram M…

Ernie Image

MakeBanner.ai

Photo Grid C…

Face Shape D…

Nano Banana …

SciFig

Pixelied
