


Coroot AI
What is Coroot AI?
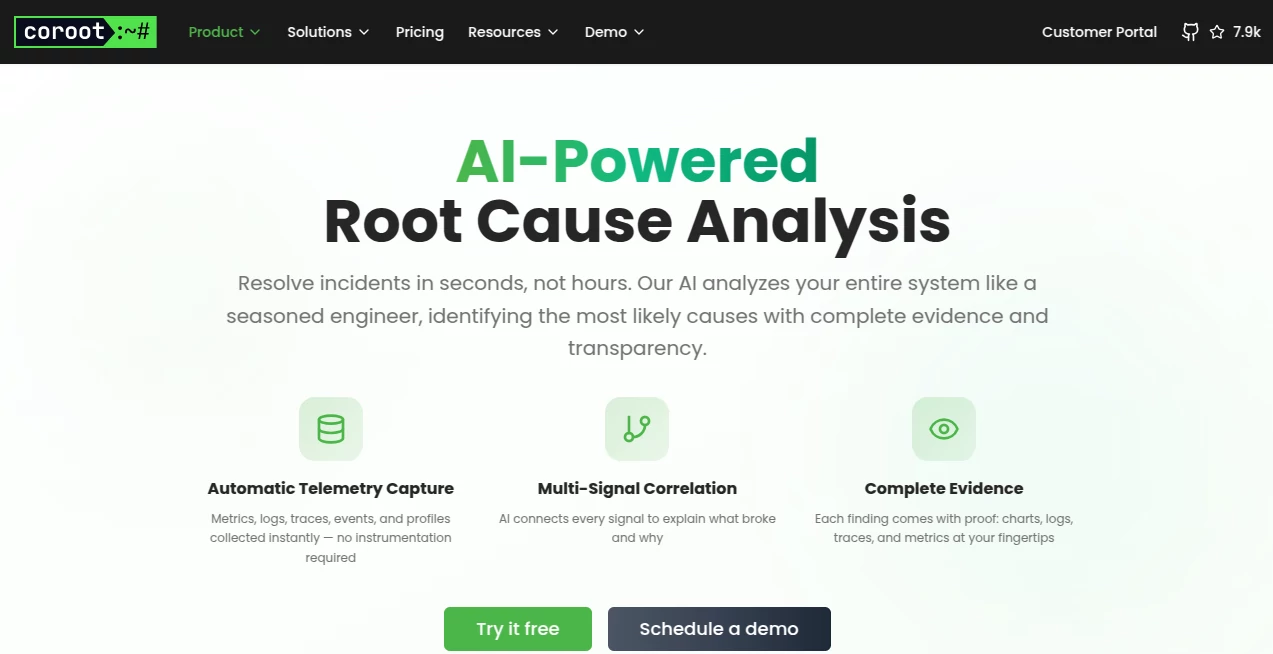
Coroot brings AI into one of the most time-consuming parts of modern infrastructure management: figuring out why something went wrong. Instead of leaving engineers to jump between dashboards, logs, traces, metrics, and service dependencies, it analyzes the available telemetry and turns the investigation into a clear explanation of what happened and where the problem is likely coming from.
The platform is built around full-stack observability and uses eBPF-based data collection to capture important signals without requiring application instrumentation or code changes. Its AI-powered root cause analysis can then correlate those signals, investigate incidents, and present possible causes together with supporting evidence and suggested fixes.
For an SRE or DevOps team dealing with a sudden latency spike, failing service, or cascading error, that approach can make troubleshooting considerably less frustrating. Rather than simply reporting that something is unhealthy, the system tries to explain the chain of events behind the failure.
Key Features
- AI-powered root cause analysis: Investigates incidents and identifies likely causes using the broader context of the monitored system.
- Automatic telemetry capture: Collects metrics, logs, traces, events, and profiles without requiring manual instrumentation.
- Multi-signal correlation: Connects changes across different telemetry sources to reveal relationships that may be difficult to spot manually.
- Dependency mapping: Builds a live view of applications, databases, and infrastructure so teams can understand how services depend on each other.
- Evidence-backed findings: Findings can be checked against charts, logs, traces, and metrics rather than being presented as unexplained AI guesses.
- Incident investigation: Provides both quick automated analysis and deeper breakdowns of affected services, resource behavior, and failure chains.
- AI-assisted alert evaluation: AI can evaluate certain log and Kubernetes-event alerts to distinguish potentially meaningful problems from noise.
User Interface
The interface is designed around observability rather than a conversational chatbot. Engineers can move from an incident to the affected service, inspect the dependency chain, review telemetry, and examine the evidence behind an AI-generated hypothesis.
This is particularly useful during an incident because the information stays connected. Instead of opening several monitoring products and manually comparing timestamps, users can investigate the system from a unified view. The presentation also makes it possible to challenge an AI conclusion by checking the underlying charts, logs, traces, and metrics.
Accuracy & Performance
The quality of any automated root cause analysis depends heavily on the quality and context of the telemetry available to it. The platform addresses this by collecting multiple types of system signals and building a model of service dependencies before generating explanations.
Its analysis can correlate latency changes, errors, resource consumption, traces, logs, and other signals to narrow down possible causes. The important advantage is that findings are accompanied by evidence, giving an engineer a practical way to verify whether the suggested explanation matches what actually happened.
For teams working with complex production environments, this can reduce the amount of time spent manually following a trail of unrelated alerts. It does not remove the need for engineering judgment, but it can make the first investigation much faster.
Capabilities
The AI functionality goes beyond generating a short incident summary. It can follow the dependency graph from an affected service, correlate anomalies across the stack, identify likely causes, explain the failure in plain language, and suggest possible remediation steps.
Deep-dive investigations provide additional context, including affected services, resource usage patterns, failure chains, and the timeline of an incident. The platform can also work with several LLM providers, including Anthropic models, OpenAI models, and OpenAI-compatible APIs such as those offered by DeepSeek and Google Gemini.
Another useful capability is its agent-ready observability approach. Observability data can be exposed through the Model Context Protocol, allowing compatible AI agents to investigate live production systems using structured telemetry rather than relying on screen scraping.
Security & Privacy
A notable aspect of the platform is its support for self-hosted and on-premises deployments. This gives organizations greater control over where their observability data is processed and stored, which can be important when logs and telemetry contain operationally sensitive information.
Authentication and role-based access controls are available, with enterprise deployments adding more granular permission management and single sign-on capabilities. For AI integrations, organizations can also configure the model provider and API credentials used for analysis.
Teams should still review their own data-handling requirements and the configuration of any external LLM provider before sending production telemetry for AI analysis.
Use Cases
- Production incident response: Quickly investigate outages, latency spikes, error increases, and service failures.
- Kubernetes troubleshooting: Correlate Kubernetes events with application behavior and infrastructure signals.
- Microservices monitoring: Follow dependencies and identify where failures propagate through a distributed application.
- Performance investigations: Examine resource usage, traces, metrics, and logs when an application becomes unexpectedly slow.
- DevOps operations: Give engineering teams a shared observability environment for monitoring and troubleshooting.
- SRE workflows: Reduce repetitive investigation work while keeping engineers in control of the final diagnosis.
- Alert noise reduction: Use AI evaluation to help identify log and Kubernetes-event alerts that may represent noise rather than actionable incidents.
Pros and Cons
Pros
- Combines metrics, logs, traces, events, and profiles in one observability workflow.
- AI analysis is supported by underlying telemetry and visible evidence.
- eBPF-based collection can provide deep infrastructure visibility without application code changes.
- Useful for distributed systems and Kubernetes environments.
- Supports multiple LLM providers and OpenAI-compatible APIs.
- Self-hosting provides greater control over infrastructure and telemetry.
- The pricing model for the enterprise edition is based on CPU cores rather than charging separately for individual telemetry signals.
Cons
- It is primarily designed for engineering, DevOps, and SRE teams rather than general business users.
- Setting up a full observability environment can require infrastructure knowledge.
- AI root cause analysis is an enterprise feature, while Community Edition users need the cloud integration to access AI investigations.
- AI conclusions should still be verified against the supplied evidence, especially during critical production incidents.
Pricing Plans
The Community Edition provides a way to run the observability platform without an enterprise subscription. AI-powered root cause analysis can be added to Community Edition through the cloud integration, which currently includes 10 free investigations per month.
The Enterprise Edition starts at $1 per CPU core per month and includes AI-powered root cause analysis along with additional enterprise capabilities and priority support. The AI configuration supports multiple model providers, allowing teams to choose an appropriate LLM rather than being locked into a single provider.
A free trial is available for teams that want to evaluate the enterprise functionality before committing to a subscription. Pricing and included features can change, so checking the current plan details before purchase is recommended.
How to Use It
- 1. Choose a deployment: Deploy the Community or Enterprise Edition according to your infrastructure and feature requirements.
- 2. Connect your environment: Set up the required observability components and node agents for the infrastructure you want to monitor.
- 3. Start collecting telemetry: Allow the platform to gather metrics, logs, traces, events, and profiles from your environment.
- 4. Monitor the system: Use the dashboards, service maps, alerts, and performance views to understand normal system behavior.
- 5. Investigate an incident: Select an anomaly or incident and start an AI root cause investigation.
- 6. Review the evidence: Examine the suggested cause alongside relevant charts, logs, traces, and metrics.
- 7. Apply the suggested fix: Use the recommendations as a starting point, then verify the change against your production environment.
Comparison with Similar Tools
Traditional observability platforms such as Datadog, New Relic, Grafana-based stacks, and other monitoring solutions can provide excellent dashboards and telemetry exploration. The main distinction here is the emphasis on connecting observability with automated root cause investigation.
Instead of treating AI as a separate chat interface where an engineer manually pastes logs and error messages, the AI works with telemetry already collected from the monitored environment. That contextual approach is valuable when an incident involves several services and the answer is spread across multiple signals.
The self-hosted model is another important consideration. Organizations that want deeper control over infrastructure and observability data may prefer this approach, while teams looking for a fully managed monitoring experience may find a conventional cloud-first platform more convenient.
Ultimately, the best choice depends on infrastructure size, deployment preferences, existing monitoring tools, and how much value a team expects from automated incident investigation.
Conclusion
AI-powered root cause analysis is most useful when it is connected to the real system rather than operating in isolation, and that is where this platform makes a strong impression. It combines broad telemetry collection, dependency mapping, system observability, and AI investigation into a workflow aimed at answering the question engineers actually care about: what caused the problem?
The evidence-first approach is especially appealing. An AI explanation is much more useful when an engineer can immediately inspect the logs, traces, metrics, and charts behind it. For DevOps and SRE teams managing Kubernetes, microservices, cloud infrastructure, or complex production environments, this can turn a long manual investigation into a much more focused process.
It is not a replacement for experienced engineers, but it can give them a significantly better starting point when an incident occurs. For teams that want observability with an intelligent troubleshooting layer on top, it is a compelling option worth testing.
Frequently Asked Questions (FAQ)
What does this AI tool do?
It uses telemetry from monitored infrastructure to investigate incidents, identify likely root causes, explain what happened, and suggest possible fixes. It can work across metrics, logs, traces, events, profiles, and service dependencies.
Does it require application code changes?
The platform's eBPF-based observability approach can collect important telemetry without requiring application instrumentation or code changes for its core data collection.
Which AI models are supported?
The enterprise AI configuration supports Anthropic models, OpenAI models, and OpenAI-compatible APIs. The documentation currently lists Claude Opus 4.6, GPT-5.2, and compatible providers such as DeepSeek and Google Gemini.
Can it be self-hosted?
Yes. Community and Enterprise editions can be deployed in environments such as Kubernetes and Docker, making self-hosted operation an important part of the platform's offering.
Is AI root cause analysis available for free?
Community Edition users can connect to the cloud integration and receive 10 free root cause investigations per month. AI-powered root cause analysis is also included in the Enterprise offering, which starts at $1 per CPU core per month.
Is it useful for Kubernetes?
Yes. Kubernetes is one of the supported observability environments, and the platform can use Kubernetes events alongside application and infrastructure telemetry during monitoring and incident investigation.
Can engineers verify the AI's conclusions?
Yes. Findings are accompanied by supporting evidence such as charts, logs, traces, and metrics, allowing engineers to inspect the data behind a suggested root cause instead of accepting an unexplained answer.
AI Log Management , AI Developer Tools , AI Monitor & Report Builder , AI DevOps Assistant .
These classifications represent its core capabilities and areas of application. For related tools, explore the linked categories above.

Coroot AI Alternatives Product

Reverse Imag…

Geekflare AI

Blackbox AI

Agent Grid

Lovable APP

Project Mela

Velokey

Schema Synth

CodeProt