


















PaperFig
What is PaperFig?
PaperFig is an AI-powered scientific figure maker designed to help researchers transform complex ideas, research concepts, and scientific explanations into clear, publication-ready visuals. Instead of spending hours manually arranging diagrams, icons, and labels, researchers can turn descriptions, sketches, images, or references into professional scientific figures faster and more efficiently.
Creating high-quality figures is often one of the most time-consuming parts of preparing research papers, presentations, and academic materials. This platform simplifies the process by helping scientists visualize mechanisms, workflows, graphical abstracts, and technical concepts while maintaining a style that fits modern academic publications.
Key Features
- Text-to-Figure Generation: Convert research descriptions and scientific ideas into structured visual figures.
- Sketch-to-Figure Creation: Transform rough drawings into polished scientific illustrations.
- Reference-Based Generation: Use existing figures or images as inspiration for creating new visuals.
- PDF and Image Input: Work with different research materials and improve existing scientific graphics.
- Editable Labels: Modify generated text labels without recreating the entire figure.
- High-Quality Export: Download visuals suitable for manuscripts, presentations, and academic use.
- Research-Focused Templates: Generate figures across multiple scientific disciplines.
User Interface
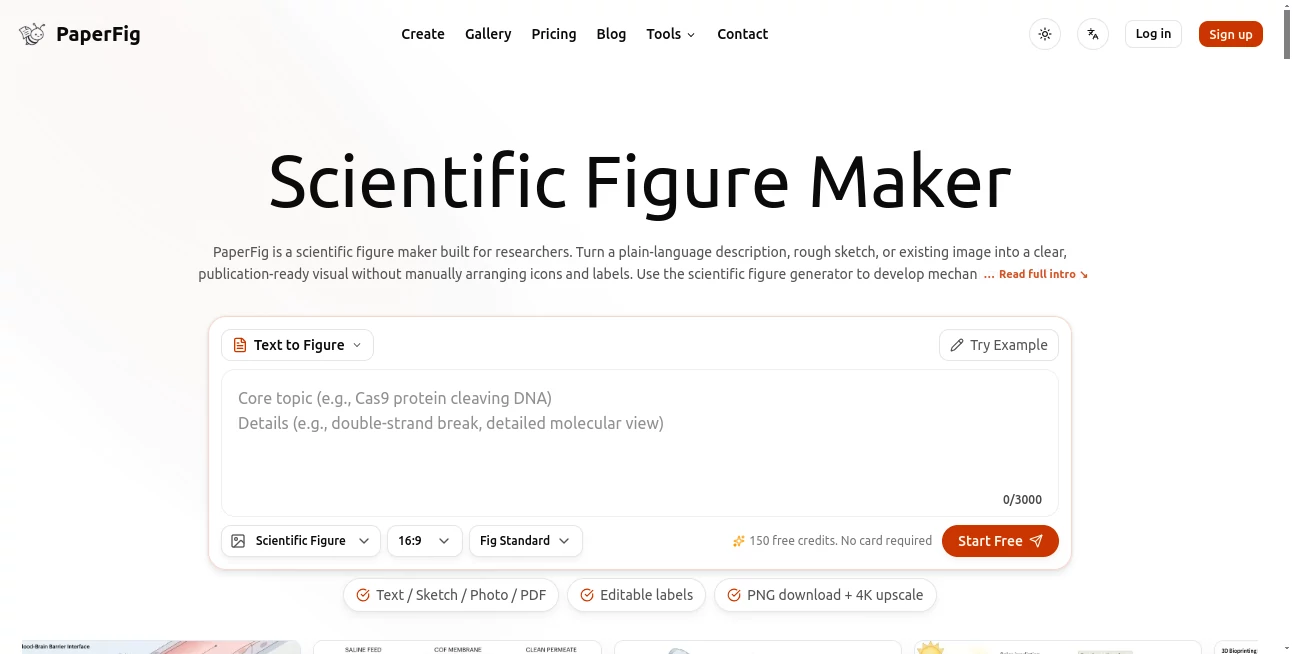
The interface is designed around a simple research workflow. Users can start with a scientific description, upload a reference, or provide an early sketch and quickly move toward a refined visual result. The clean design reduces the learning curve, making it accessible for researchers who may not have professional design experience.
The workflow feels practical for everyday academic tasks. A researcher preparing a manuscript can create an initial figure, adjust important details, and export the final version without switching between multiple design applications.
Accuracy & Performance
Scientific communication requires precision, and this tool focuses on producing visuals that clearly represent research concepts rather than generic AI-generated artwork. It is built around scientific figure styles, helping users create diagrams that match the expectations of academic audiences.
The system supports multiple input methods, allowing researchers to refine ideas gradually. Whether starting from a simple sentence describing a mechanism or an existing visual draft, it provides a faster path from concept to finished illustration.
Capabilities
The platform supports a wide range of scientific visualization needs, including mechanism diagrams, workflows, graphical abstracts, and educational illustrations. Researchers from fields such as biomedical science, materials science, environmental research, energy, engineering, and computer science can use it to communicate complex information more effectively.
It is especially useful when a research idea is difficult to explain with words alone. A well-designed figure can make complicated processes easier to understand for journal reviewers, students, collaborators, and conference audiences.
Security & Privacy
Research materials often contain valuable information, so privacy is an important consideration. The platform is designed to support researchers working with academic content while providing tools that help them prepare professional visuals without unnecessary complexity.
Use Cases
- Scientific Publications: Create figures and graphical abstracts for research papers.
- Academic Presentations: Design clear visuals for conferences, lectures, and seminars.
- Laboratory Communication: Explain experiments, workflows, and mechanisms inside research teams.
- Education: Build understandable scientific illustrations for teaching materials.
- Grant Proposals: Present research ideas visually to improve communication with reviewers.
Pros and Cons
Pros
- Designed specifically for scientific and academic visualization.
- Supports multiple input methods including text, sketches, images, and PDFs.
- Helps reduce the time needed for creating research figures.
- Useful for researchers without advanced graphic design skills.
- Provides export options suitable for professional workflows.
Cons
- Advanced customization may still require manual editing for highly specialized figures.
- Researchers working on very unique visual styles may need additional design tools.
Pricing Plans
The platform offers a free option that allows users to explore figure generation with included credits. Researchers who need more frequent creation, advanced editing features, higher-quality exports, and additional monthly credits can choose from paid plans designed for individual researchers and laboratories.
Different pricing levels are available for students, active researchers, and teams that regularly create scientific visuals for publications and projects.
How to Use PaperFig
- Create an account or start with the available free credits.
- Choose an input method such as text description, sketch, image, or reference material.
- Describe the scientific concept or figure you want to create.
- Review the generated visual and adjust labels or details.
- Export the final figure for your paper, presentation, or research project.
Comparison with Similar Tools
Unlike general AI image generators that focus on artistic content, this solution is built around scientific communication. Traditional design software provides powerful editing capabilities but often requires significant time and experience. This platform combines AI assistance with research-focused workflows, making the process more efficient for academics.
For researchers who need accurate scientific diagrams rather than decorative images, a specialized figure creation tool can provide a more suitable experience.
Conclusion
Creating clear scientific figures is essential for sharing research ideas effectively. This AI-powered solution helps researchers move from complex concepts to professional visuals with less manual work. By combining scientific workflows with modern AI capabilities, it offers a practical way to improve research communication, presentations, and publications.
For scientists, educators, and academic teams looking to create better visuals without spending excessive time on design, this platform provides a valuable addition to the research workflow.
Frequently Asked Questions (FAQ)
What type of figures can be created?
Users can create scientific diagrams, mechanism illustrations, workflows, graphical abstracts, and research-related visuals.
Can I use my own sketches or images?
Yes, users can provide sketches, images, references, and other materials to guide the figure creation process.
Is it useful for journal publications?
The generated visuals are designed to help researchers prepare professional figures suitable for manuscripts and academic presentations.
Do I need graphic design experience?
No. The platform is designed to help researchers create visuals without requiring advanced design skills.
Can generated figures be edited?
Yes, users can refine elements such as labels and improve figures before exporting the final version.
AI Photo & Image Generator , AI Diagram Generator , AI Research Tool , AI Presentation Generator .
These classifications represent its core capabilities and areas of application. For related tools, explore the linked categories above.

PaperFig Alternatives Product

meigen ai

VexImg

ForexCoupons

MakeGraph

AI Entity

Krea 2 AI

Twistly

upscayl

GPT Image 2
