











Wavelength
What is Wavelength?
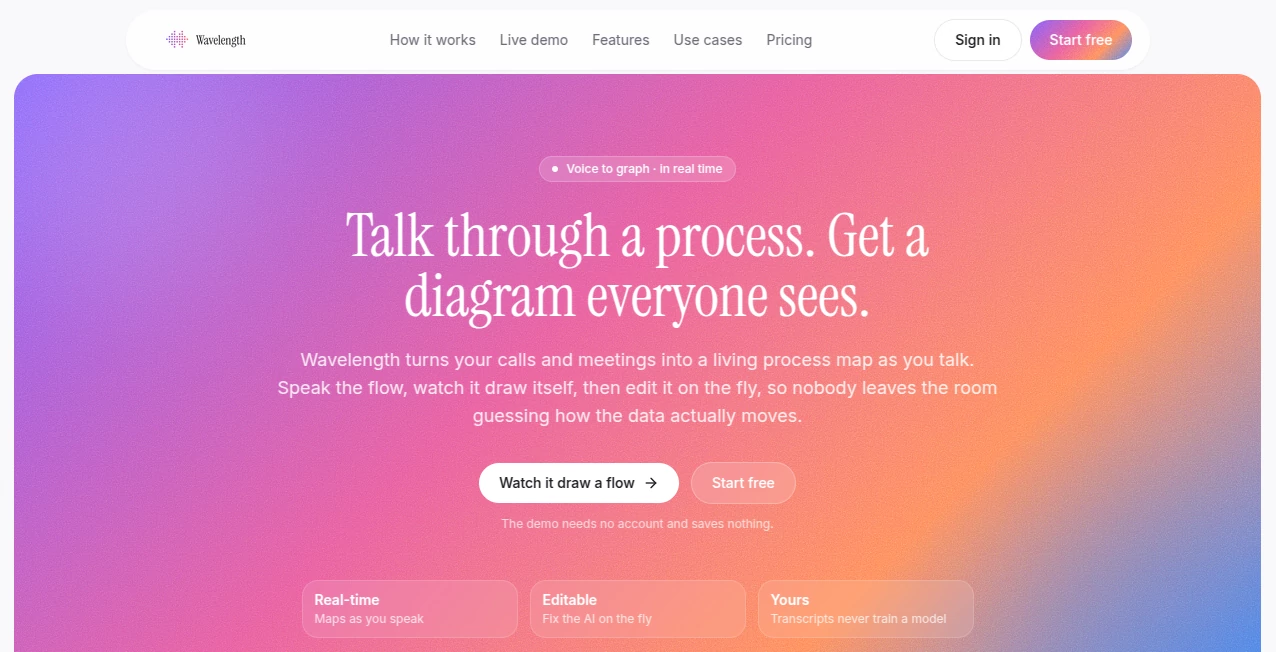
Wavelength is a voice-to-diagram tool built for people who need to explain technical processes without stopping to draw every box and connection by hand. Instead of turning a discovery call or architecture discussion into pages of rough notes, users can speak naturally, paste a transcript, and watch a process map take shape in real time.
The idea is particularly useful for sales engineers, solution architects, technical project managers, consultants, and teams running process discovery workshops. A conversation that would normally leave everyone with a slightly different understanding of the workflow can finish with a shared, editable visual map.
Key Features
- Real-time voice to graph: Speak through a process naturally and let the system structure the flow as the conversation progresses.
- Transcript-to-diagram workflow: Users can paste a transcript instead of speaking directly, making it practical for recorded calls and existing meeting notes.
- Complex flow mapping: The system can organize branches, pipelines, hierarchies, systems, owners, and connections into a visual process.
- Multiple editing methods: Generated diagrams can be changed using an AI instruction, a right-click menu, or direct manual editing.
- Confidence cues: AI-generated assumptions are shown with dashed amber connections until they are reviewed and confirmed.
- Branding: Users can add a logo watermark to the canvas and exported PNG files.
- Export and follow-up: Completed flows can be saved, versioned, exported as PNG files, and accompanied by an email recap.
User Interface
The interface is designed around a simple idea: explain the process first and refine the visual result afterward. That makes the experience feel closer to having a visual facilitator in a meeting than using a traditional diagramming application.
The editing workflow is also flexible. Someone who prefers natural-language instructions can describe a change, while another user can right-click an element or reshape connections manually. This combination is useful in collaborative sessions where different people naturally work in different ways.
Accuracy & Performance
The strongest part of the workflow is its focus on making AI-generated assumptions visible. Rather than presenting every inferred connection as unquestionable fact, uncertain AI guesses are visually distinguished until someone confirms them. That small detail can be valuable during technical discussions, where an incorrect relationship between systems can create confusion later.
Performance is also centered on real-time interaction. The purpose is not simply to generate a diagram from a block of text after the meeting, but to help teams build and validate the process map while the discussion is still happening.
Capabilities
The platform is especially suited to process-oriented diagrams rather than formal modeling standards. It can capture data flows, operational processes, system relationships, pipelines, responsibilities, and other structures that are commonly discussed during technical meetings.
It is also designed for iterative work. A process can be described, visualized, corrected, and reshaped without starting the diagram from scratch. This makes it practical for discovery sessions where requirements change as people ask questions and clarify details.
Security & Privacy
When using any tool that processes meeting conversations or technical workflows, organizations should review its current privacy and data-handling policies before submitting confidential material. The public product information focuses heavily on the diagramming workflow and does not provide enough detail to make broad claims about enterprise security controls, data retention, or compliance.
For sensitive architecture discussions, customer information, or proprietary processes, teams should verify the applicable privacy terms and internal security requirements before using real production data.
Use Cases
- Sales and solution demos: Map a prospect's data flow during a discovery call so participants can see the same process while discussing it.
- Architecture reviews: Turn a spoken explanation of a system design into an editable diagram that can be reviewed with the team.
- Onboarding: Convert process walkthroughs into visual maps that new employees can follow more easily.
- Operations and process mapping: Document how work moves between people, software, and data stores without spending hours drawing manually.
- Discovery workshops: Build a current-state process map during the workshop and validate it with stakeholders before the session ends.
- ERP implementation: Capture existing processes during fit-gap discovery and leave the session with a visual representation of the current workflow.
Pros and Cons
Pros
- Turns spoken explanations into visual process maps.
- Supports both live voice input and transcripts.
- Useful for technical discovery and architecture conversations.
- Allows AI-assisted, contextual, and manual editing.
- Makes uncertain AI-generated connections visible for review.
- Supports PNG export, sharing, versioning, and email follow-up.
- Offers a free plan for getting started.
Cons
- It is focused on process and flow mapping rather than being a universal diagramming platform.
- It is not designed specifically for formal standards such as UML, BPMN 2.0, ERDs, or C4 models.
- Teams working with highly confidential meeting content should review privacy and data-handling details before use.
Pricing Plans
The service offers a free entry point, allowing users to start mapping flows without a payment card. For users who need additional capacity and professional features, paid plans are available.
- Free: A no-cost option for getting started with flow mapping.
- Starter: $9.99 per month or $99.90 per year.
- Pro: $19.99 per month or $199.90 per year, including unlimited flows, a logo watermark, and version history.
The pricing structure makes it relatively easy for an individual professional or small team to test the workflow before committing to a paid plan.
How to Use It
- Open the application and start a new flow.
- Use the microphone and describe the process in plain language, or paste an existing transcript.
- Let the system organize the information into a visual flow.
- Review the generated branches, connections, systems, and ownership relationships.
- Confirm or correct any connections that were inferred by the AI.
- Refine the diagram using natural-language instructions, the contextual menu, or direct editing.
- Add branding if required and save the completed flow.
- Export the result as a PNG, share the flow, or send an email recap.
Comparison with Similar Tools
Traditional diagramming platforms such as Lucidchart, Miro, and Microsoft Visio are excellent choices when users want broad control over manually created diagrams and collaborative canvases. The approach here is different: the main input is conversation rather than drawing.
That distinction matters in meetings. Instead of pausing a discussion to decide where another box should go, a participant can continue explaining the workflow and refine the generated map afterward. Diagram-as-code approaches offer another useful alternative for technical teams that prefer source-controlled diagrams, but they generally require users to express the structure through a formal syntax rather than simply talking through it.
For a team that already has a mature manual diagramming workflow, switching may not be necessary. For teams that regularly leave discovery calls with incomplete sketches and scattered notes, the voice-first approach can save a meaningful amount of documentation work.
Conclusion
The most compelling aspect of this tool is not simply that it can create diagrams with AI. It is the decision to make conversation itself the starting point for process mapping. That fits naturally into discovery calls, architecture reviews, workshops, and technical discussions where the information already exists in people's explanations.
The real benefit appears when a team can finish a meeting with a diagram that reflects what was actually discussed rather than asking someone to reconstruct the process afterward. With live voice mapping, transcript support, visible confidence cues, flexible editing, and straightforward exports, it offers a practical alternative to starting every technical process map with a blank canvas.
Frequently Asked Questions (FAQ)
What is this tool used for?
It is designed to turn spoken descriptions and meeting transcripts into editable process diagrams and flow maps.
Do I need to draw the diagram manually?
No. You can describe the process naturally through the microphone or provide a transcript, after which the system structures the information visually.
Can I edit an automatically generated diagram?
Yes. You can make changes using natural-language instructions, a right-click menu, or direct manual editing.
Can it handle complex processes?
It is designed to structure branches, pipelines, hierarchies, systems, and ownership relationships, making it suitable for many technical and operational workflows.
Can I export the diagrams?
Yes. Completed flows can be exported as PNG files and shared with other people. The workflow also supports email recaps.
Is there a free plan?
Yes. A free plan is available, with paid Starter and Pro options for users who need additional features and capacity.
Is it suitable for UML or BPMN diagrams?
It is not positioned as a dedicated UML, BPMN 2.0, ERD, or C4 modeling tool. Its focus is conversational process and flow mapping.
Who can benefit most from it?
Sales engineers, solution architects, technical project managers, consultants, operations teams, and professionals who regularly document processes during meetings can benefit from the workflow.
AI Diagram Generator , AI Productivity Tools , AI Meeting Assistant .
These classifications represent its core capabilities and areas of application. For related tools, explore the linked categories above.

Wavelength Alternatives Product
AltHunt

TruthSpine

AntForms

ApplyBtn

YouTube Thum…
Caspian
MikeSullyToo…

Khuram Youraj

Hairstyle An…