
🧠 AI Quiz
Think you really understand Artificial Intelligence?
Test yourself and see how well you know the world of AI.
Answer AI-related questions, compete with other users, and prove that
you’re among the best when it comes to AI knowledge.
Reach the top of our leaderboard.


columns.ai
Instant Charts from Any Web Text
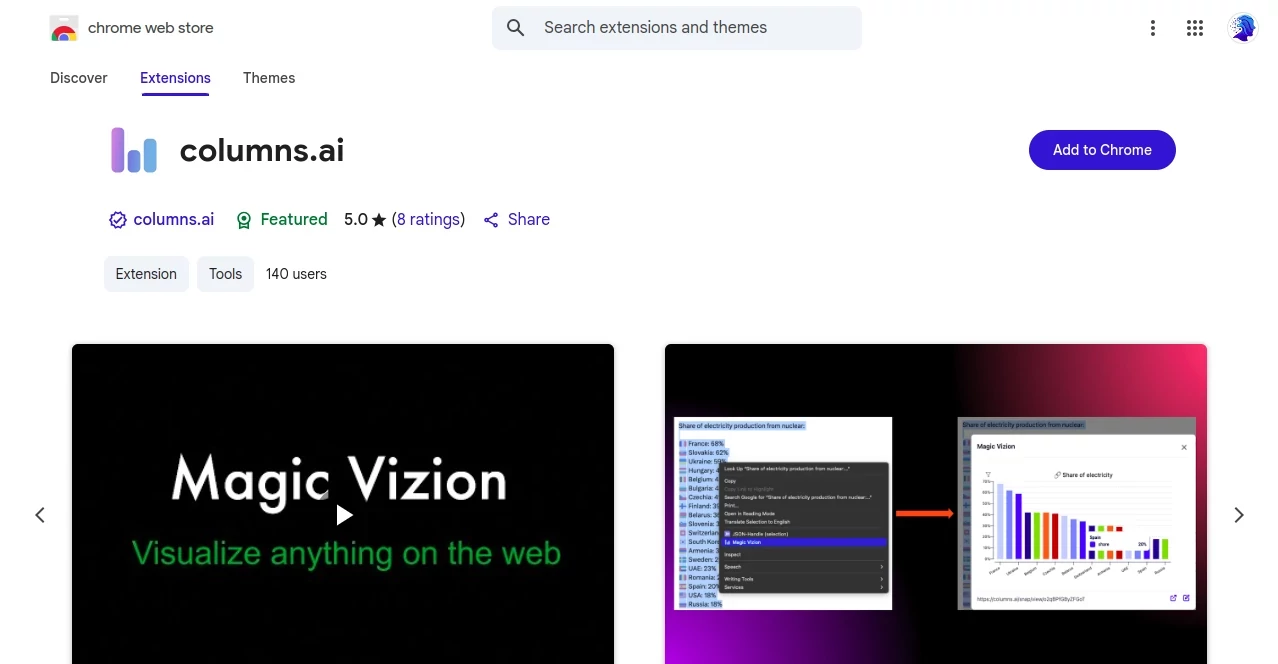
What is columns.ai?
ColumnsAI slips into your browser like a quiet genius, ready to spin paragraphs or tables into crisp visuals with one click. Researchers, students, and curious minds now turn dense pages into clear stories, spotting trends that hide in plain sight. It's the little helper that makes sense of the web's endless info dump, saving hours of copying and pasting.
Introduction
ColumnsAI arrived fresh this fall, born from a team's itch to see data dance without leaving the page. Early fans—mostly analysts glued to reports—raved about ditching clunky spreadsheets for magic right-clicks. In weeks it earned perfect stars from its first eight users, proof that simple ideas can spark big wins. What hooks people is the no-fuss flow: highlight, click, watch numbers leap into bars or pies that tell the tale better than words ever could.
Key Features
User Interface
It lives quietly in your right-click menu—no bulky panels stealing screen space. Select a chunk of text, pick “Magic Vizion,” and a sleek overlay pops with your fresh chart. Clean lines, soft colors, and draggable corners make tweaks feel playful, while a full-tab button expands the canvas for deeper dives, all without ever feeling crowded.
Accuracy & Performance
It sniffs out numbers and labels like a bloodhound, plotting them true even in messy paragraphs. Charts render in a blink on modest laptops, staying snappy across news sites or dense PDFs. Testers love how it rarely misreads context, turning quarterly stats or poll results into spot-on visuals that match manual builds every time.
Capabilities
From bar stacks to line trends or pie slices, it juggles common chart types and auto-picks the best fit. Open the full editor to swap colors, add titles, or export PNGs for slides. It handles plain text, HTML tables, or copied clipboard scraps, bridging the gap between reading and presenting in seconds.
Security & Privacy
Your selections stay local—no data phones home unless you share the chart. The team swears off selling snippets, locking everything behind strict rules that keep your browsing habits yours alone. A short privacy page spells it out plain, earning trust from cautious pros who live in sensitive tabs.
Use Cases
Students grab poll paragraphs from articles and drop pie charts into essays before the bell. Marketers scan competitor reports, flipping revenue tables into bars that wow the boss. Journalists spotlight election numbers mid-scroll, crafting shareable graphics on deadline. Even hobby investors chart crypto mentions across forums, turning chatter into watchlists without switching apps.
Pros and Cons
Pros:
- One-click magic that needs zero learning curve.
- Lightning renders keep your flow unbroken.
- Free forever with pro-level polish.
- Exports ready for decks or tweets in seconds.
Cons:
- Advanced maps or 3D still wait in the wings.
- Heavy jargon can trip the auto-picker sometimes.
- No dark mode yet for night owls.
Pricing Plans
ColumnsAI gives away the full ride for zero cents—install and chart to your heart's content. No tiers, no ads, no catch. The team hints at optional tips down the road, but for now it's pure open-hand generosity, perfect for classrooms or bootstrapped teams.
How to Use ColumnsAI
Grab it from the store, pin the icon if you like, then surf as usual. Spot a stat block, drag your mouse across, right-click, and choose Magic Vizion. Tweak the preview or hit “Open in Tab” for full controls. Save as image, copy to clipboard, or share the link—done before your coffee cools.
Comparison with Similar Tools
Older copy-paste add-ons force you into separate apps; ColumnsAI keeps everything in-browser and smarter. Against full dashboard suites, it wins on speed and zero cost, though power users might miss scheduled pulls. It carves a sweet spot for instant, everyday insights where others overcomplicate or underdeliver.
Conclusion
ColumnsAI proves that the best tools vanish into the background, leaving only clearer thinking behind. It hands the web's hidden patterns to anyone curious enough to highlight them, democratizing data one right-click at a time. As pages grow denser, this lightweight wizard keeps curiosity alive and insights flowing.
Frequently Asked Questions (FAQ)
Does it work on mobile Chrome?
Desktop only for now—mobile menus don't play nice yet.
Can I save charts for later?
Export PNG or bookmark the tab link to revisit anytime.
What if the text has no numbers?
It skips gracefully or suggests word clouds for sentiment.
Is my data sent anywhere?
Never—processing happens on your machine alone.
Will it get more chart types?
Roadmap teases heatmaps and scatters soon.
AI Data Mining , AI Diagram Generator , AI Charting , AI Productivity Tools .
These classifications represent its core capabilities and areas of application. For related tools, explore the linked categories above.
columns.ai details
This tool is no longer available on submitaitools.org; find alternatives on Alternative to columns.ai.
Pricing
- Free
Apps
- Chrome Extensions
Categories

columns.ai Alternatives Product

Motion

Vurge

Liftburst

SlideStorm AI

Classroom Sc…

AI Diagram M…

JSON to Excel

ChatGPT

Grok 4
