
🧠 AI Quiz
Think you really understand Artificial Intelligence?
Test yourself and see how well you know the world of AI.
Answer AI-related questions, compete with other users, and prove that
you’re among the best when it comes to AI knowledge.
Reach the top of our leaderboard.


Infography
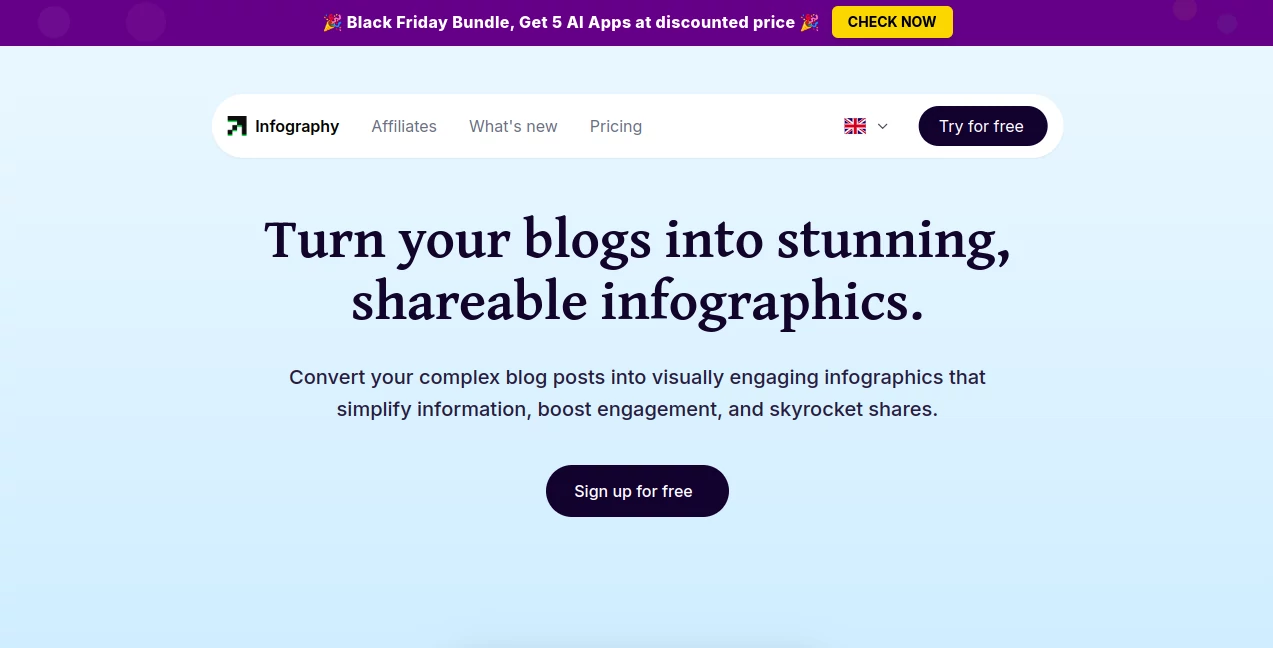
What is Infography?
Infography slips into the content creator's toolkit like a breath of fresh air, whisking lengthy articles into eye-catching visuals that pull readers in at a glance. This handy service takes the heavy lifting out of design, letting bloggers and marketers focus on the story while it handles the sparkle. Those who've given it a whirl often chat about how it transformed a dense post into a share magnet, saving hours that would otherwise vanish into graphic tweaks.
Introduction
Infography came about a couple years back, sparked by the realization that great writing often gets lost in walls of text that scare off busy scrollers. A team of storytellers and designers banded together to bridge that gap, crafting a spot where words morph into maps of meaning without the usual hassle. It caught on quick in creator circles, with folks swapping screenshots of before-and-afters that turned yawners into yays. What keeps it buzzing is that gentle hand-holding through the process, turning even the most wordy ramble into something snackable and sharp, all while keeping the original voice intact.
Key Features
User Interface
The dashboard feels like a cozy workshop, starting with a simple paste-in for your piece and a few nudges on style or tone that guide without overwhelming. As it brews, a preview pane lights up with draft layouts you can shuffle or shade on the fly, all in a layout that flows clean on desktop or dash. No deep dives into menus—just intuitive drags and a real-time refresh that makes tweaking feel like casual doodling rather than a design degree.
Accuracy & Performance
It sifts through your script with a keen eye, pulling key beats into balanced blocks that echo the flow without fluff or fumbles. Outputs land steady and swift, often in under a couple minutes for standard lengths, holding up crisp across shares or screens. Users nod at how it rarely mangles the message, delivering diagrams that click with the core ideas even on twisty topics.
Capabilities
From blog bursts to PDF pulls, it chews content into custom charts, icons, and flows that fit your flavor, whether minimalist lines or bold pops. Layer in extras like calls to action or data dips, and it blends them seamless, spitting out files ready for social blasts or site embeds. The real charm lies in handling niches, from tech deep dives to lifestyle loops, always aiming for that visual hook that holds the gaze.
Security & Privacy
Your drafts get a quick pass and then a clean slate, processed in pockets that keep things private without permanent prints. It lets you lock down shares or scrap sessions at will, ensuring sensitive scoops stay under wraps. Content folks count on that straightforward shield, letting them test bold takes without a whisper of worry about wandering words.
Use Cases
Bloggers bundle how-tos into handy overviews that fly on feeds, drawing dips into the full read. Marketers map campaign recaps for team huddles, turning stats into stories that stick. Educators etch lesson bites for handouts, simplifying spreads that spark student sparks. Even newsletter nester nest visuals that nudge open rates, proving its pull across the content canvas.
Pros and Cons
Pros:
- Snaps text to sight in a snap, slashing design drags.
- Stays true to the tale, no twists on the truth.
- Versatile vibes for any voice or venue.
- Share-ready from the start, boosting buzz built-in.
Cons:
- Longer tomes might need a trim for tight fits.
- Custom curves call for pro plans to unlock full flair.
- Occasional odd layouts on super-specific slants.
Pricing Plans
A lite layer lets you linger for free with basics like a handful of builds monthly, perfect for poking around. Pro pushes to thirty bucks a month for endless efforts, credit stacks for extras, and team tags up to five, with speedy support tossed in. Yearly yields save a slice, keeping the gate low for those just starting to sketch.
How to Use Infography
Drop your draft into the dock, pick a palette or path from the prompts, and let it layer the layout. Peek at the proof, prod panels if needed, then pluck the polished piece in your pick of formats. Slot it straight to shares or stash for later spins, turning one post into a pack of visuals that keep giving.
Comparison with Similar Tools
Where some spit stock stacks that feel stiff, Infography infuses the input's soul, though those might muster more manual might for the meticulous. Against broader brushes, it hones in on blog-to-boom without the bloat, skipping side gigs but shining on story snaps. It slots sweet for swift synthesizers, edging out the elaborate with ease and essence.
Conclusion
Infography wraps words in wonder, handing creators a shortcut to sights that sing without the strain. It turns the tide on text tombs, proving visuals can vault a voice further than fine print alone. As content keeps crowding, this gem gleams as a guide, inviting all to illustrate ideas that illuminate and inspire.
Frequently Asked Questions (FAQ)
What content clicks best?
Articles, outlines, or outlines shine, pulling peaks into pictures.
Can I tweak the templates?
Pro pals get the prod, with drags for custom curves.
Exports in what wraps?
PNG pops, PDFs for pros, or embeds for easy slots.
Team-friendly?
Higher hands hold shares for squad syncs.
Quick as claimed?
Most in minutes, with credits keeping the count.
AI Content Generator , AI Design Generator , AI Graphic Design , AI Presentation Generator .
These classifications represent its core capabilities and areas of application. For related tools, explore the linked categories above.
Infography details
This tool is no longer available on submitaitools.org; find alternatives on Alternative to Infography.
Pricing
- Free
Apps
- Web Tools
Categories

Infography Alternatives Product

Banana Pro

Modelfy 3D
PromptFix

Flow Veo 3

Create a Car…

Filmpitch

ImageKontext…

Prompt Sloth

NanoBanana2F…
