🧠 AI Quiz
Think you really understand Artificial Intelligence?
Test yourself and see how well you know the world of AI.
Answer AI-related questions, compete with other users, and prove that
you’re among the best when it comes to AI knowledge.
Reach the top of our leaderboard.


Online Chart Maker
A Simple Tool for Data Visualization
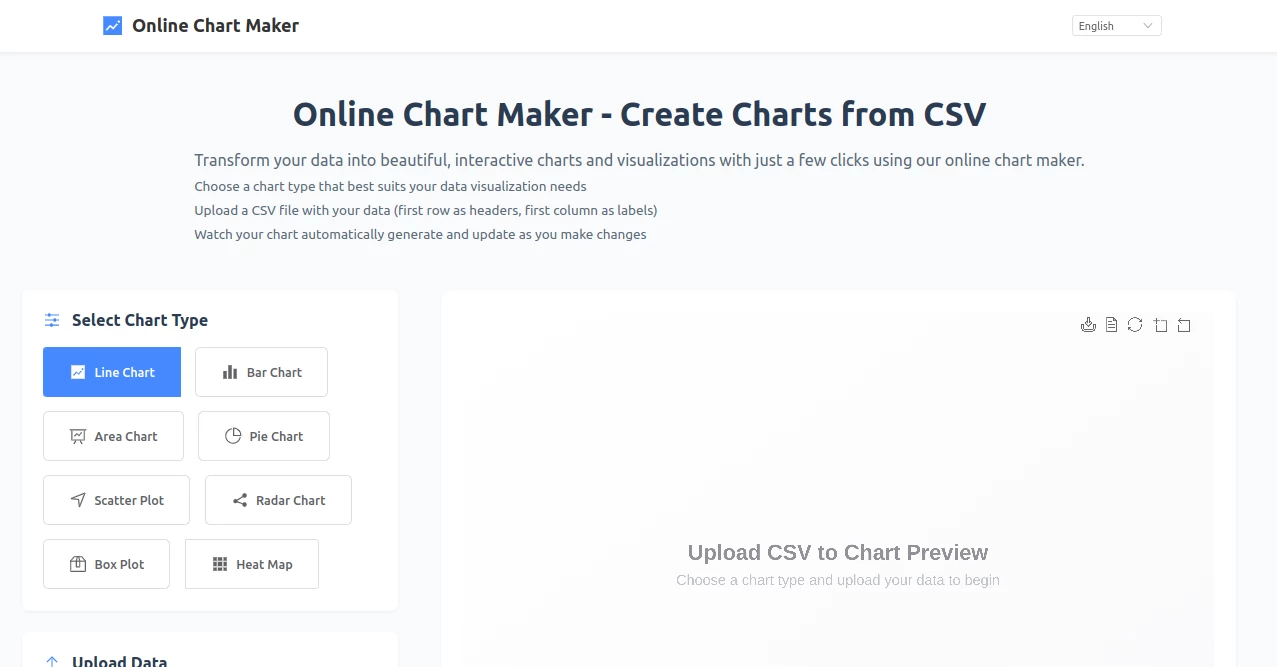
What is Online Chart Maker?
OnlineChartMaker.com is a web-based chart creation tool that allows users to transform raw data into visually engaging charts and graphs. With its intuitive interface, the platform supports a variety of chart types, making it suitable for reports, presentations, and educational purposes. It requires no registration or payment, ensuring accessibility for all users.
Key Features of OnlineChartMaker
- Wide Range of Chart Types: The platform supports multiple chart formats, including bar charts, line charts, pie charts, and more, allowing users to choose the best representation for their data.
- Easy Data Input: Users can manually input data or import it from CSV files, making it simple to work with datasets from tools like Microsoft Excel or Google Sheets.
- Real-Time Preview: As users enter or modify data, the tool provides a live preview of the chart, enabling quick adjustments to ensure the desired outcome.
- Customization Options: Users can adjust colors, labels, titles, and fonts to match their preferences or branding requirements.
- Export and Sharing: Charts can be downloaded as PNG images or embedded into websites and presentations, making it easy to share visuals with others.
- No Account Required: The tool is completely free and does not require users to create an account, ensuring a hassle-free experience.
Benefits of Using OnlineChartMaker
The simplicity and accessibility of OnlineChartMaker.com make it a valuable tool for a wide range of users. Here are some key benefits:
- User-Friendly Interface: The platform is designed with non-designers in mind, offering a straightforward process for creating professional-quality charts.
- Time-Saving: With pre-built templates and an intuitive workflow, users can create charts in minutes, saving time compared to complex software.
- Cost-Free: Unlike many other chart-making tools that require subscriptions or one-time purchases, this platform is entirely free.
- Versatile Applications: Whether for business reports, academic projects, or personal data visualization, the tool caters to diverse needs.
- Privacy-Focused: Data processing occurs in the user's browser, ensuring that sensitive information remains secure and is not stored on external servers.
How to Use OnlineChartMaker
Creating a chart on OnlineChartMaker.com is a simple process. Follow these steps to get started:
- Select a chart type from the available options, such as bar, line, or pie charts.
- Input your data manually or upload a CSV file to populate the chart.
- Customize the chart by adjusting colors, labels, and other design elements.
- Preview the chart in real-time to ensure it meets your expectations.
- Download the chart as an image or copy the embed code for use in websites or presentations.
Who Can Benefit from OnlineChartMaker?
The platform is ideal for a variety of users, including:
- Business Professionals: Create charts for sales reports, market analysis, or performance tracking.
- Educators and Students: Visualize data for classroom projects, research papers, or teaching materials.
- Content Creators: Enhance blog posts, social media content, or infographics with engaging visuals.
- Small Business Owners: Present financial data or customer insights without investing in expensive software.
Limitations to Consider
While OnlineChartMaker.com offers many advantages, there are some limitations:
- Limited Advanced Features: The tool focuses on simplicity, so it may lack some advanced functionalities found in premium software.
- Internet Dependency: As a web-based tool, it requires an internet connection to function.
- Basic Templates: While sufficient for most users, the template library may not be as extensive as some competitors.
Conclusion
OnlineChartMaker.com is an excellent choice for anyone looking to create professional charts quickly and easily. Its free access, user-friendly interface, and versatile chart options make it a go-to tool for visualizing data in a clear and impactful way. Whether you're preparing a business presentation, an academic project, or a social media post, this platform provides the tools you need to communicate your data effectively. Visit OnlineChartMaker.com today to start transforming your data into stunning visuals.
These classifications represent its core capabilities and areas of application. For related tools, explore the linked categories above.

Online Chart Maker Alternatives Product

Graph Maker

Manus

AI Diagram M…

FlowGPT

SuperAI