🧠 AI Quiz
Think you really understand Artificial Intelligence?
Test yourself and see how well you know the world of AI.
Answer AI-related questions, compete with other users, and prove that
you’re among the best when it comes to AI knowledge.
Reach the top of our leaderboard.
RootPulse

What is RootPulse?
RootPulse feels like that one teammate who always knows exactly where the real problem hides, even when everyone else is chasing symptoms. You feed it logs, metrics, traces—whatever chaos your system is throwing at you—and it calmly points straight to the root cause with surprising clarity. I've seen teams spend hours or days digging through dashboards, only to have this tool surface the answer in minutes. It's not just fast; it actually helps you trust your fixes the first time.
Introduction
In the middle of a production incident, the last thing you want is to guess. This tool was built precisely for those high-pressure moments when every second counts, turning raw observability data into a clear story of what broke and why. It integrates seamlessly with the tools you already use—Datadog, Grafana, Sentry, New Relic, and more—pulling in the signals that matter and connecting the dots that humans often miss under stress. What started as an internal solution for a team tired of alert fatigue has grown into a trusted companion for SREs, platform engineers, and DevOps leads who want to spend less time firefighting and more time building.
Key Features
User Interface
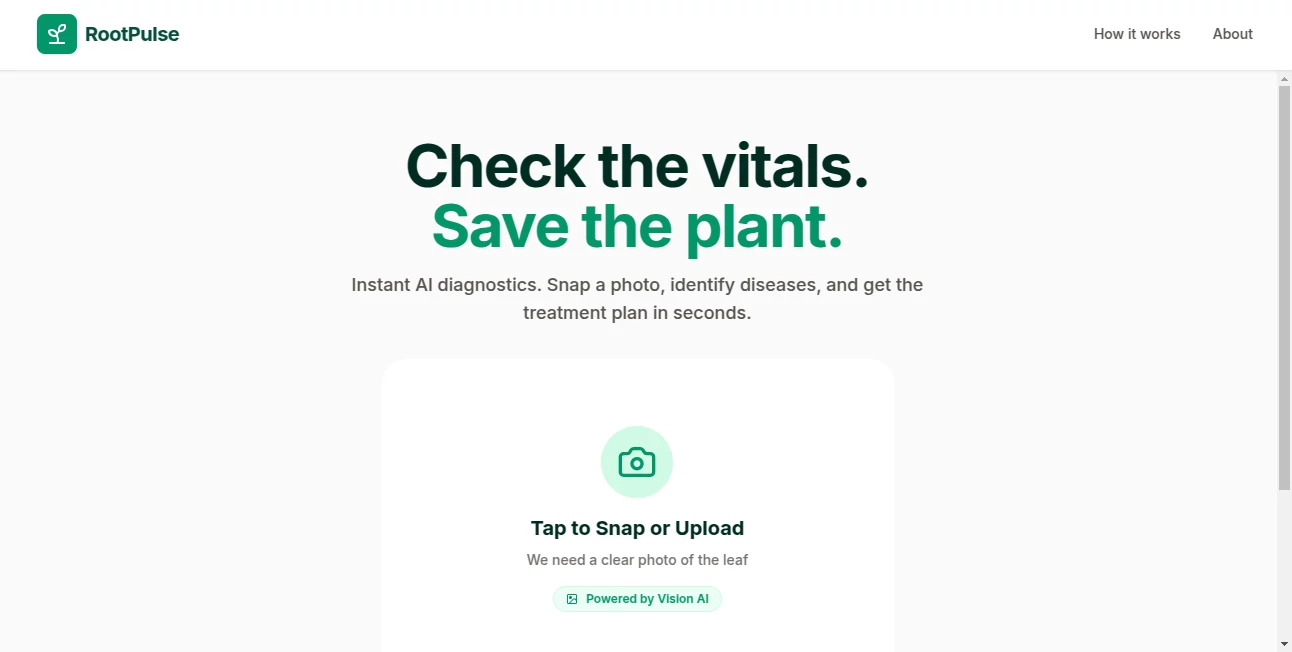
The dashboard is refreshingly clean: a timeline view that highlights the incident window, correlated metrics, and a concise summary of the root cause at the top. No overwhelming walls of data—just the signals that actually matter, with clickable drill-downs when you need to go deeper. I appreciate how it avoids the "dump everything" trap; instead, it surfaces the most relevant context first, letting you stay focused rather than hunting for the needle.
Accuracy & Performance
The AI doesn't just correlate events—it understands causality. It looks at dependencies, change windows, and historical patterns to pinpoint the actual culprit, not just the loudest symptom. In practice, teams report hitting the right root cause on the first try far more often than with manual investigation. And it does this quickly—usually in under a minute—so you can act before the outage escalates.
Capabilities
Beyond basic correlation, it handles multi-cloud and hybrid environments effortlessly, ingesting data from dozens of sources without needing custom parsers. It can even suggest remediation steps or automated rollbacks when it detects known patterns. For complex microservices setups, it traces the blast radius across services and infrastructure, giving you a full picture of impact and cause in one view.
Security & Privacy
Your data never leaves your environment unless you explicitly choose to. The on-prem or VPC-deployed option keeps everything internal, while the cloud version uses encrypted connections and strict access controls. It's built with enterprise security in mind—SOC 2 Type II compliant and designed to fit into regulated workflows without compromising observability.
Use Cases
An e-commerce platform used it during Black Friday prep to catch a subtle database connection leak that would have taken hours to find manually. A fintech team cut MTTR from 45 minutes to under 10 by letting it surface the root cause of intermittent API failures. SREs love it for post-incident reviews, where it generates accurate timelines and summaries that make blameless retrospectives actually useful. Even smaller teams use it to punch above their weight, turning what used to be all-night war rooms into quick, focused fixes.
Pros and Cons
Pros:
- Surprisingly accurate root cause detection, even in noisy environments
- Integrates with almost every observability tool out of the box
- Reduces MTTR dramatically—teams consistently report 50–80% faster resolution
- Privacy-first deployment options (on-prem, VPC, cloud)
- Clean, focused UI that respects your time
Cons:
- Still relatively new, so the community and integrations are growing
- Advanced features (like automated remediation) are in beta or early access
Pricing Plans
It starts with a generous free tier that lets you test it on a single service—enough to prove value in your own environment. Paid plans scale with the number of services you monitor, starting at a reasonable monthly rate that feels fair for the time it saves. Enterprise options offer dedicated support, custom integrations, and on-prem deployment. Most teams find it pays for itself after just one or two prevented outages.
How to Use RootPulse
Sign up, connect your observability sources (takes about 5 minutes), and let it ingest a few days of data to build a baseline. When an incident hits, jump into the incident view—it auto-detects anomalies and surfaces the root cause. Review the timeline, drill into correlated metrics, and share the report with your team. For ongoing use, set up alerts that link directly to the tool, so the next time things go sideways, you're already one step ahead.
Comparison with Similar Tools
While other tools do anomaly detection or correlation, few combine it with true causal inference and deep integration across the entire stack. Many rely on manual queries or simple rule-based alerts, whereas this one actually understands dependencies and change impact. It's less about alerting you to problems and more about telling you exactly why they happened—and how to stop them from happening again.
Conclusion
In the end, this tool isn't just about faster incident resolution—it's about giving you back control in a world where systems keep getting more complex. It turns the stressful, guesswork-filled part of DevOps into something almost predictable. If you've ever stared at a broken system wondering where to even start, this is the quiet revolution you've been waiting for. Give it a spin during your next on-call rotation; you might just find yourself wondering how you ever managed without it.
Frequently Asked Questions (FAQ)
How long does it take to set up?
Usually under 15 minutes if your observability tools are already sending data.
Does it work with on-prem setups?
Yes, full on-prem and VPC deployment options are available.
What observability tools does it support?
Datadog, Grafana, Prometheus, New Relic, Sentry, Honeycomb, and more.
Can it prevent incidents?
It can't prevent them yet, but it helps you spot patterns early and suggests fixes based on historical data.
Is there a free trial?
Yes, the free tier lets you monitor a single service indefinitely.
AI Research Tool , AI Analytics Assistant , AI Developer Tools .
These classifications represent its core capabilities and areas of application. For related tools, explore the linked categories above.
RootPulse details
This tool is no longer available on submitaitools.org; find alternatives on Alternative to RootPulse.
Pricing
- Free
Apps
- Web Tools


