🧠 AI Quiz
Think you really understand Artificial Intelligence?
Test yourself and see how well you know the world of AI.
Answer AI-related questions, compete with other users, and prove that
you’re among the best when it comes to AI knowledge.
Reach the top of our leaderboard.


T29
What is T29?
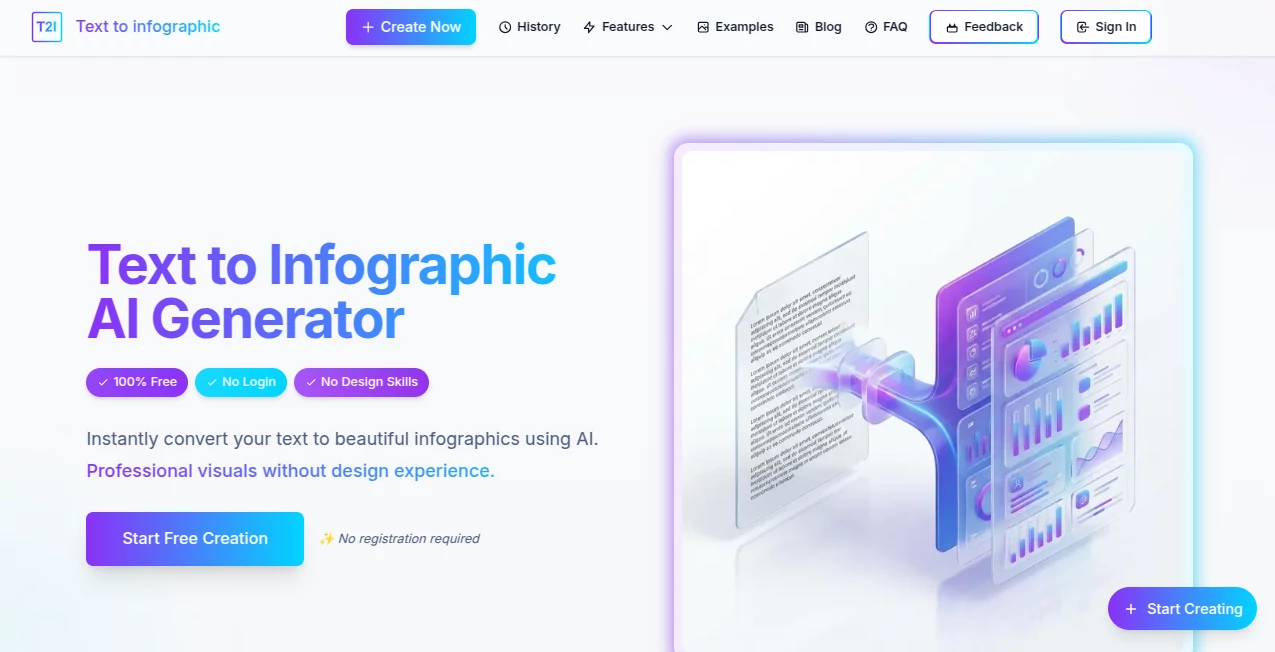
There's something genuinely satisfying about watching a wall of text transform into a clean, eye-catching visual that tells the story at a glance. This tool nails that magic, pulling key ideas from your words and arranging them into layouts that look like they took hours in a design studio. I tried it with a rambling blog draft the other day, and out came a sharp summary graphic that made the points pop—perfect for pinning on social or sliding into a presentation without a single tweak.
Introduction
In a rush of information overload, turning dense paragraphs into something digestible can feel like a superpower—and this platform hands it over freely. It scans whatever you paste in, spots the main threads and data bits, then builds a structured infographic that highlights relationships and flows naturally. No sign-ups, no fees, just straightforward creation that works across languages and spits out files ready for anywhere. Folks who've leaned on it for quick visuals swear by the time saved, especially when prepping reports or sharing insights that need to stick without scrolling forever.
Key Features
User Interface
It keeps things blissfully simple: a big open field for your text, a button to kick things off, and then a preview that lets you grab the result in one go. Choose horizontal for slides or vertical for phones, and that's about it—no overwhelming options that bog you down. My first run felt like chatting with a helpful designer who just gets it, delivering something usable without the usual back-and-forth.
Accuracy & Performance
The smart bit here digs into your content thoughtfully, picking out core points and connections without dropping the ball on nuances, often wrapping up in a minute or two even for longer pieces. It handles the layout balance well, spacing elements so nothing feels crammed or lost. From what I've seen, it rarely missteps on straightforward inputs, turning potential chaos into coherent visuals that hold attention longer.
Capabilities
Feed it articles, essays, reports, or summaries—up to a generous chunk of text—and it crafts infographics with smart visuals, icons, and flows that enhance the message. Multi-language support means it detects and rolls with whatever tongue you throw, while export choices cover the basics for screens or prints. It's particularly handy for pulling data highlights or timelines without you lifting a finger beyond the paste.
Security & Privacy
Since there's no account or lingering storage, your text vanishes after the job's done, keeping things light and worry-free. It's the kind of no-fuss approach that suits quick shares or sensitive notes, letting you create without leaving traces or handing over details.
Use Cases
Bloggers condense posts into shareable teasers that drive clicks back to the full read. Teachers turn lesson notes into handouts that ease the load for students scanning key facts. Marketers whip up quick visuals for campaigns, highlighting stats that sway decisions. Researchers summarize findings for conferences, making complex papers approachable in a slide or poster.
Pros and Cons
Pros:
- Completely free with solid results, no barriers to entry.
- Fast turnaround that fits into tight schedules seamlessly.
- Handles various languages without missing a beat.
- Clean downloads ready for immediate use.
Cons:
- Customization stays light, leaning on auto magic for now.
- Longer texts cap out, so big tomes need chopping.
Pricing Plans
It's all on the house—no tiers, no upsells, just unlimited access to the core creation without a penny asked. That straightforward generosity makes it a standout for anyone dipping toes into visual summaries or relying on them daily.
How to Use Text to Infographic
Copy your content, drop it into the field—aim for under the character sweet spot—and pick your orientation if the default doesn't fit. Tap generate, wait a short breath, then eye the preview before snagging it in your preferred file type. I often run a couple versions by trimming the input, ending up with options that suit different shares perfectly.
Comparison with Similar Tools
While some demand accounts or charge for clean exports, this one keeps the door wide open with quality that punches well, especially for no-cost runs. It skips the heavy editing suites for speed and simplicity, landing stronger on pure text-to-visual leaps where others wander into manual tweaks or paywalls early.
Conclusion
This tool quietly excels at bridging words and visuals, making dense info inviting and memorable without effort on your end. It's a genuine helper for anyone juggling content that needs to land quick and clear, turning everyday text into standout graphics worth sharing. Give it a spin with your next summary; the difference in engagement might just surprise you.
Frequently Asked Questions (FAQ)
How much text can I throw in?
Up to 10,000 characters—plenty for most articles or reports.
Does it cost anything?
Not a cent; fully free with no catches.
What formats come out?
PNG, JPG, or PDF, clean and ready.
Works with non-English text?
Yes, detects and handles multiple languages smoothly.
How long does it take?
A minute or two, depending on length.
AI Diagram Generator , AI Content Generator , AI Design Generator , AI Presentation Generator .
These classifications represent its core capabilities and areas of application. For related tools, explore the linked categories above.
T29 details
This tool is no longer available on submitaitools.org; find alternatives on Alternative to T29.
Pricing
- Free
Apps
- Web Tools
Categories

T29 Alternatives Product
promptcat

wu tang name…

ReezoAI

NanoBanana2F…

MuseCraft.AI

Invitation M…
deck cleaner

Fine Image

Edit Stamp