🧠 AI Quiz
Think you really understand Artificial Intelligence?
Test yourself and see how well you know the world of AI.
Answer AI-related questions, compete with other users, and prove that
you’re among the best when it comes to AI knowledge.
Reach the top of our leaderboard.


NarraViz AI
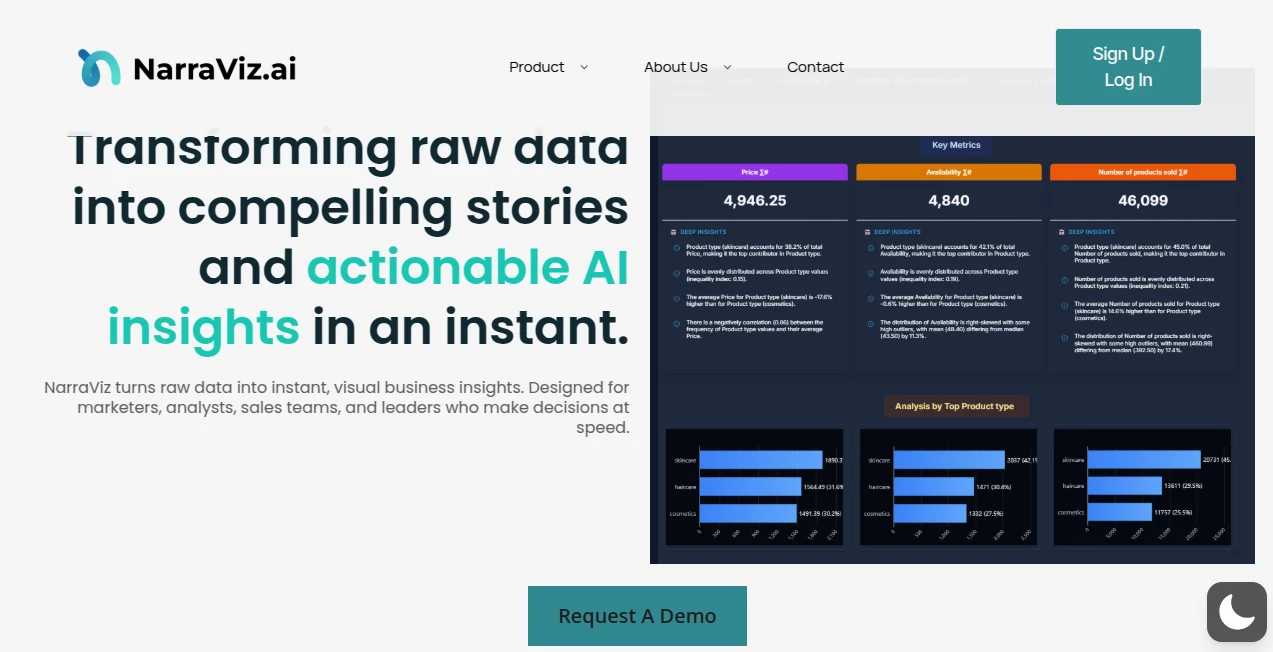
What is NarraViz AI?
Have you ever stared at a spreadsheet full of numbers and wished there was an easy way to make people actually care about what it says? This tool does exactly that. It takes your raw data and transforms it into clear, compelling visual stories that anyone can understand in seconds. I remember the first time I used something like this for a client report—suddenly the room went quiet, people leaned in, and the questions changed from “what does this mean?” to “how do we act on this?” That’s the kind of shift it creates, and it happens fast.
Introduction
Most data tools focus on making charts, but this one goes further: it helps you tell a story with your numbers. Designed for marketers, analysts, and anyone who needs to communicate insights without losing their audience, it combines smart automation with beautiful design choices. The result? Presentations, reports, or social posts that feel polished and purposeful instead of dry and technical. What really stands out is how quickly it turns messy datasets into something that feels intentional and human. In a world drowning in dashboards, this is the tool that makes people stop scrolling and start listening.
Key Features
User Interface
The interface is clean and surprisingly intuitive. You drag in your data, choose a narrative direction, and it suggests layouts, colors, and visuals that actually make sense together. Everything is visual-first—no need to dig through menus to find the right chart type. The preview updates in real time, so you can experiment without fear of breaking anything. It feels less like a tool and more like a creative partner that’s always one step ahead.
Accuracy & Performance
It handles complex datasets without choking, and the visualizations stay accurate even when you’re working with large files. The AI doesn’t just slap on random charts—it understands relationships in the data and suggests visuals that actually highlight what matters. Speed is impressive too; even on bigger projects, you’re not left waiting forever. I’ve used it on last-minute reports and it’s never let me down.
Capabilities
Beyond basic charts, it creates full narrative flows—think sequential slides or animated sequences that guide the viewer through your story step by step. You can mix bar charts, line graphs, maps, and custom visuals all in one cohesive piece. It also supports brand colors, fonts, and logos, so your output always feels like it belongs to your company. The ability to export in multiple formats (PDF, PNG, interactive web links) makes it flexible for any use case.
Security & Privacy
Your data stays secure. Files are processed in a private environment and not stored long-term. For teams, there are role-based access controls and audit logs. It’s built with enterprise-grade security in mind, so you don’t have to worry about sensitive information leaking. That level of care gives real peace of mind, especially when you’re dealing with client or internal data.
Use Cases
Marketing teams use it to turn campaign metrics into executive summaries that actually get read. Sales reps create one-pagers for client meetings that tell a story instead of just dumping numbers. Non-profits showcase impact reports that move donors instead of boring them. Even educators turn dry research data into engaging lesson visuals. It’s versatile enough to fit anywhere you need to explain numbers in a way that sticks.
Pros and Cons
Pros:
- Turns complex data into clear, beautiful narratives without design skills
- Fast and intuitive—great for tight deadlines
- Strong focus on storytelling, not just charts
- Secure and enterprise-ready
- Multiple export formats, including interactive
Cons:
- Best results come from clean, well-structured data
- Advanced customization options are still growing
Pricing Plans
It starts with a free tier that lets you explore core features and create a few visuals. Paid plans unlock unlimited exports, team collaboration, and premium templates. Pricing is reasonable for what you get, especially compared to hiring a designer or buying enterprise dashboard software. They also offer a generous trial period so you can really test it in your workflow.
How to Use Narraviz
Sign up, upload your dataset (CSV, Excel, Google Sheets), and let it suggest a narrative flow. Pick the direction that fits your goal—executive overview, detailed breakdown, or social-ready graphic. Tweak colors and fonts to match your brand, preview the story, and export. The whole process usually takes under 15 minutes once you’re familiar. Start with something simple like sales data or survey results; you’ll see the difference immediately.
Comparison with Similar Tools
Traditional dashboard tools are great for live monitoring but often feel cold and technical. This one is built for communication, not just analysis. Compared to design-heavy platforms, it’s faster and requires less manual work. Compared to AI chart generators, it goes deeper into storytelling and narrative flow. It sits in a sweet spot: powerful enough for pros, approachable enough for anyone who needs to make data speak.
Conclusion
This tool bridges the gap between raw data and real understanding. It doesn’t just make charts—it helps you tell the story behind the numbers in a way that actually lands with people. Whether you’re pitching to executives, educating your team, or engaging an audience online, it gives you an edge that’s hard to ignore. Once you start using it, going back to plain spreadsheets feels like stepping into the past. Give it a try; your next report might just become the one everyone remembers.
Frequently Asked Questions (FAQ)
Do I need design skills to use it?
No. The tool handles most of the design decisions for you. You just guide the story.
What kind of data works best?
Any structured data—sales, surveys, KPIs, metrics. The cleaner the better, but it handles messiness well.
Can I use my brand colors and logos?
Yes, easily. You can upload brand assets and apply them across all visuals.
Is the output interactive?
Yes, you can export interactive versions that let viewers explore the data.
How long does it take to create something?
Usually 5–15 minutes for a complete story, depending on complexity.
AI Content Generator , AI Design Generator , AI Presentation Generator .
These classifications represent its core capabilities and areas of application. For related tools, explore the linked categories above.
NarraViz AI details
This tool is no longer available on submitaitools.org; find alternatives on Alternative to NarraViz AI.
Pricing
- Free
Apps
- Web Tools
Categories

NarraViz AI Alternatives Product

AIGAZOU

Seedream 5.0
Niji V7

LongCat Image

NepVox

Aiso

Presenti AI

Paper Animat…

GenPPT AI