🧠 AI Quiz
Think you really understand Artificial Intelligence?
Test yourself and see how well you know the world of AI.
Answer AI-related questions, compete with other users, and prove that
you’re among the best when it comes to AI knowledge.
Reach the top of our leaderboard.


Online GANTT
Visualize Your Projects Effortlessly
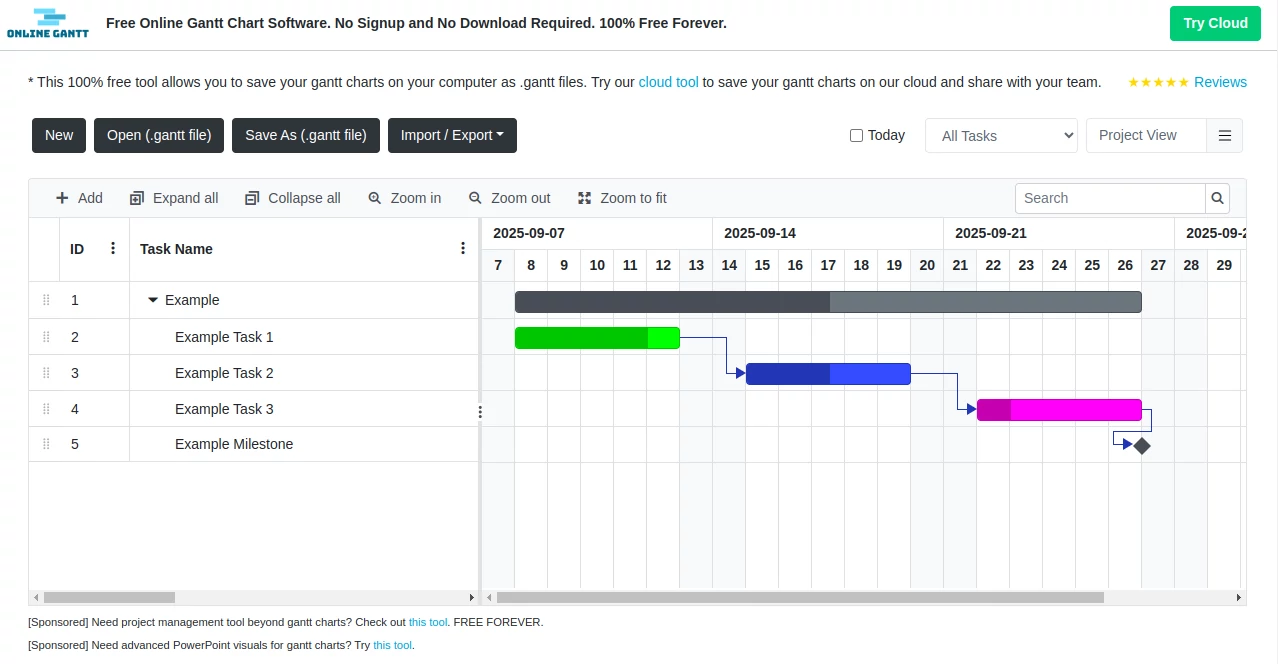
What is Online GANTT?
OnlineGantt provides a straightforward way for teams and individuals to map out timelines and dependencies in their work. It's the kind of tool that turns complex schedules into clear visuals, helping everyone stay on the same page without the hassle of complicated setups. Perfect for anyone juggling multiple tasks, it brings order to chaos with just a few clicks.
Introduction
When it comes to keeping track of projects, nothing beats a solid visual aid, and OnlineGantt fills that role admirably. Launched to address the common pain points of traditional planning methods, this web-based service lets users create detailed charts right in their browser. Over the years, it has gained traction among small businesses and freelancers who appreciate its no-fuss approach to organizing workflows. By focusing on simplicity and accessibility, OnlineGantt has become a reliable choice for those who want to plan ahead without getting bogged down in technical details. Its evolution mirrors the shift toward more collaborative and remote-friendly work environments, making it a timely resource in today's fast-paced world.
Key Features
User Interface
The dashboard greets you with a clean slate, featuring drag-and-drop elements for adding tasks and adjusting timelines. Navigation is intuitive, with side panels for managing resources and a central canvas for the main view. Colors and labels help differentiate phases at a glance, and the responsive design ensures it works well on desktops or tablets, keeping the experience fluid no matter the device.
Accuracy & Performance
Updates to charts happen in real time, reflecting changes instantly without lag, which is crucial during team collaborations. The system handles large datasets smoothly, calculating dependencies and critical paths with precision to avoid errors in planning. This reliability means users can count on the output for important decisions, backed by consistent processing speeds that don't falter under pressure.
Capabilities
From basic task listing to advanced milestone tracking, OnlineGantt covers the essentials and more. Users can set up dependencies between items, assign roles to team members, and even export views in various formats for sharing. It supports multiple projects in one workspace, allowing for easy switching and overview, while built-in reminders keep everyone notified of upcoming deadlines.
Security & Privacy
Data is protected through standard encryption for all uploads and shares, ensuring that sensitive project details stay confidential. Access levels can be customized for viewers or editors, preventing unauthorized changes. Compliance with common data standards adds another layer of assurance, giving users peace of mind when working with client information or internal strategies.
Use Cases
Construction crews use it to outline phases from groundwork to finishing touches, ensuring materials arrive on time. Marketing teams plot campaign launches, syncing creative deadlines with ad rollouts. Software developers break down sprints, visualizing bug fixes alongside feature builds. Even event planners rely on it for coordinating vendors and guest lists, turning potential oversights into seamless executions.
Pros and Cons
Pros:
- Completely free access removes barriers for small teams or solo users.
- Quick setup means you can start planning within minutes of signing up.
- Versatile export options make it easy to integrate with other tools.
- Real-time collaboration fosters better team communication.
Cons:
- Limited advanced reporting might not suit very large enterprises.
- Occasional browser compatibility issues could require tweaks.
- No offline mode means internet is always needed for full functionality.
Pricing Plans
OnlineGantt keeps things simple with a no-cost model that's open to everyone. There's no tiered structure or hidden fees; all core functionalities are available right away upon registration. For those wanting extras like custom branding or priority support, occasional premium add-ons might pop up, but the base experience stands strong on its own, making it an economical pick for most users.
How to Use OnlineGantt
Start by creating an account with your email, then head to the new project area to name your chart. Add tasks by typing them in, setting start and end dates, and linking dependencies with simple arrows. Invite collaborators via email for joint editing, and use the zoom tools to fine-tune the view. Once satisfied, hit export to share a PDF or image, or set notifications for key dates to keep momentum going.
Comparison with Similar Tools
Compared to heavier suites like Microsoft Project, OnlineGantt shines in its lightness and zero price tag, though it lacks some deep analytics. Against free alternatives such as GanttProject, it offers better online sharing without downloads, but might not match desktop power for offline work. Tools like TeamGantt provide more polished interfaces at a cost, yet OnlineGantt's straightforwardness appeals to users prioritizing speed over bells and whistles.
Conclusion
OnlineGantt proves to be a dependable ally in the realm of project visualization, delivering essential features without overwhelming users. Its commitment to accessibility and ease makes it ideal for a wide array of planning needs, from quick personal endeavors to team-driven initiatives. As projects grow more intricate, tools like this one remind us that effective management often starts with clarity and simplicity, positioning OnlineGantt as a smart, enduring choice for organized success.
Frequently Asked Questions (FAQ)
Do I need to download anything to get started?
No, everything runs directly in your web browser, so just enable JavaScript and you're good to go.
Can multiple people edit the same chart?
Yes, invite others to collaborate in real time, with options to control who can view or modify.
What formats can I export my charts to?
Popular choices include PDF, PNG, and Excel for easy sharing and further adjustments.
Is there a limit to the number of projects I can create?
With the free plan, you can handle as many as needed, though very large ones might benefit from optimization.
How does it handle task dependencies?
Simply connect tasks with lines to show sequences, and the tool automatically adjusts timelines accordingly.
These classifications represent its core capabilities and areas of application. For related tools, explore the linked categories above.
Online GANTT details
This tool is no longer available on submitaitools.org; find alternatives on Alternative to Online GANTT.
Pricing
- Free
Apps
- Web Tools
Categories

Online GANTT Alternatives Product

ClearWork

Candidate Sc…

Nifty

Ryne AI

Sourcetable

onuml

Motion

Workik

Kaamfu