


Status Central
What is Status Central?
Let’s be real for a second. If you’re running a SaaS business, managing an IT team, or just trying to keep a half-dozen cloud services running smoothly, you know the drill. Something always breaks at the worst possible moment. And half the time, you don’t even know which service is causing the headache. That’s where this little gem comes in. It’s not another complicated monitoring tool that requires a PhD to set up. It’s a clean, centralized dashboard that tells you exactly what’s working, what’s not, and what’s about to go down.
I’ve been in situations where my team spent hours debugging our app, only to find out AWS was having a regional hiccup. Hours wasted. Frustration through the roof. This tool solves that problem by pulling health statuses from all your critical providers into one single view. No more jumping between twenty different status pages. No more guessing.
Key Features
The magic of this platform isn’t in flashy AI gimmicks. It’s in raw, practical utility. It aggregates real-time health data from major cloud providers and third-party services like AWS, GitHub, Stripe, and Google Cloud. You see live conditions instantly: working, warning, or down. And when something changes, you’re not left in the dark. Immediate alerts hit your inbox or your team chat before your customers even notice a hiccup.
What really sold me was the customizable status pages. You can create internal dashboards for your team or public-facing ones to keep your users in the loop during incidents. And historical uptime tracking? It’s a lifesaver when you need to prove your reliability to stakeholders or just figure out which vendor is actually keeping their promises.
User Interface
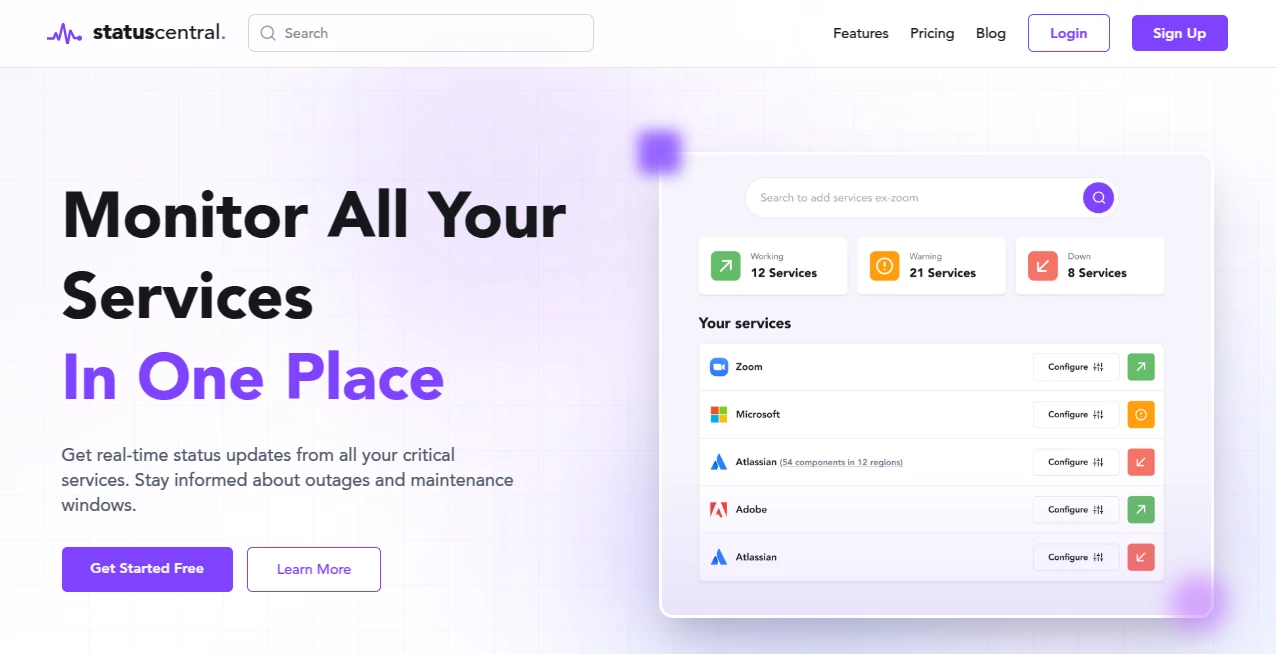
Let’s talk about the elephant in the room. Most monitoring tools look like they were designed by engineers for engineers. That means ugly graphs, buried menus, and a learning curve that never ends. This one is different. The interface is shockingly straightforward. You log in, and within sixty seconds, you’ve added your first few services. The dashboard shows everything in clear, color-coded tiles. Green means good. Yellow means caution. Red means get on it. No confusion, no clutter.
I showed it to a colleague who normally runs away from monitoring tools, and she had it configured for her team in under ten minutes. That never happens. The design philosophy here is simple: show people what they need to know, hide everything else.
Accuracy & Performance
None of this matters if the alerts are wrong. I’ve used tools that sent false alarms every other day. Eventually, you start ignoring them, and that’s when real outages slip through. This platform is reliable. The status updates are near-instant, and I haven’t experienced the kind of lag that makes you question whether the data is even current. When a service goes down, you know immediately. When it comes back up, same thing.
The incident timelines are another underrated feature. They show you exactly what happened, when it happened, and how long it lasted. That level of transparency is gold when you’re doing post-mortems or explaining to your boss why the site was slow for twenty minutes.
Capabilities
So what can it actually monitor? A lot. We’re talking AWS, GitHub, Stripe, Google Cloud, and many more. But it’s not limited to just those big names. You can add practically any service that has a public status feed. The platform checks these endpoints regularly and aggregates everything into one feed. You can also set up custom monitoring for internal tools or private infrastructure, though the real strength is in tracking all those third-party dependencies that your business relies on but you don’t control.
Think about your stack for a second. How many external services do you use? Payment processing, hosting, authentication, databases, email delivery. If any one of those goes down, your users are affected. This tool gives you a bird’s-eye view of all of them.
Security & Privacy
You might be wondering: does this tool introduce yet another security risk? Fair question. The platform is built with standard security practices. You’re not handing over the keys to your infrastructure. It reads public status feeds and monitors endpoints you designate. For teams with stricter compliance needs, you can control exactly who sees what. The customizable status pages can be locked down with passwords or kept entirely internal.
I’m not going to pretend it’s some unhackable fortress, because no tool is. But for what it does, the security model makes sense. You’re exposing status information, not sensitive customer data.
Use Cases
Who actually needs this thing? Pretty much anyone running modern digital services. Here are a few scenarios where it shines:
- IT teams and DevOps engineers – Stop playing whack-a-mole with outages. Know which service is down before you start debugging your own code.
- SaaS businesses – Keep your customers informed with public status pages. Nothing builds trust like transparency during an incident.
- Operations managers – Track uptime trends across vendors. When it’s time to renew contracts, you’ll know who actually delivered.
- Small teams without dedicated monitoring staff – You don’t need a full-time SRE to use this. Set it up once and forget about it until something breaks.
I know a guy who runs a small e-commerce store. He used to find out about payment processor outages when customers started emailing him angrily. Now he gets alerts before the first complaint rolls in. That alone saved his sanity.
Pros and Cons
Let’s be honest. No tool is perfect. Here’s what works and what doesn’t.
What works well: The centralized dashboard is a game-changer. Having AWS, GitHub, Stripe, and a dozen other services in one place saves hours of context switching. The alerting is fast and not spammy. You can tune notifications so you’re not getting woken up at 3 AM for every little blip. The free tier is generous enough for small teams to get real value without paying a cent. And the paid plans start at a reasonable price, so scaling up doesn’t hurt the budget.
What could be better: The platform is heavily focused on monitoring third-party services. If you need deep, granular monitoring of your own custom application internals, you might need to pair it with something more specialized. Also, while the interface is clean, power users might want more advanced filtering and reporting options. But for most teams, what’s there is more than enough.
Pricing Plans
Money talk. The good news is there’s a free version. You can start monitoring essential services without entering credit card details. That’s rare in this space. The free tier gives you enough to test the waters and see if it fits your workflow.
When you’re ready to scale, paid plans start around $7 per month on an annual commitment. That’s coffee money for most businesses. The paid tiers unlock more monitors, faster check intervals, team access controls, and advanced notification options. Compared to competitors that charge three or four times as much for similar features, this is aggressively priced.
There’s no long-term lock-in either. You can start free, upgrade when you need more, and downgrade if your needs change. That flexibility matters, especially for growing teams where requirements shift every few months.
How to Use Status Central
Getting started takes about five minutes. Here’s the flow:
- Sign up for a free account. No credit card required.
- Browse the library of supported services and add the ones you use. AWS, GitHub, Stripe, Cloudflare, whatever’s in your stack.
- Configure alert destinations. Email is the default, but you can also send notifications to Slack, Microsoft Teams, or Discord.
- Customize your status page if you plan to share it publicly. Add your logo, pick a color scheme, and decide which services to show.
- Test it by simulating an incident or just wait for the next real outage. You’ll get an alert, and you can see the incident timeline in the dashboard.
That’s literally it. No scripting. No YAML configuration files. No fighting with API documentation. Just point, click, and monitor.
Comparison with Similar Tools
How does this stack up against the competition? Let’s compare it to a few names you might know. UptimeRobot is a popular alternative, and it’s solid for basic uptime checking. But UptimeRobot focuses on monitoring your own websites and servers. It doesn’t aggregate statuses from third-party providers like AWS or GitHub. If your app relies on external services, UptimeRobot won’t tell you when Stripe is having issues.
Then there’s Better Stack (formerly Better Uptime). That’s a more comprehensive platform with log management and incident response features. It’s powerful but also more complex and expensive. For teams that just need status aggregation and alerting, this tool is lighter and easier to use.
Another competitor is Hexowatch, which monitors websites for visual changes and competitor updates. That’s a different use case entirely. Hexowatch is great for tracking competitor pricing or design changes. It’s not designed for real-time service health monitoring.
The bottom line? If you need deep infrastructure monitoring with logs and traces, look elsewhere. If you need a simple, affordable way to track the health of your cloud dependencies, this is hard to beat.
Conclusion
Look, monitoring doesn’t have to be painful. Most tools in this space are over-engineered, overpriced, and under-deliver on usability. This one takes the opposite approach. It does one thing well: it tells you when your critical services are having problems. No fluff. No hidden complexity. Just clear, real-time status updates and alerts that actually help.
For small teams, the free tier is a no-brainer. For larger organizations, the paid plans are cheap enough that you’re not justifying the expense to your finance department. And for anyone tired of jumping between twenty different status pages every time something feels slow, this is a genuine time-saver.
If you’ve ever wasted an hour debugging your own code only to discover that a cloud provider was the real culprit, give it a shot. You’ll wonder how you lived without it.
Frequently Asked Questions (FAQ)
Can I use this for free forever? Yes, the free tier is permanent. You get basic monitoring for a limited number of services. It’s enough for small teams or personal projects.
Does it monitor my own servers or just third-party services? It focuses on aggregating statuses from third-party providers. For monitoring your own infrastructure, you might want to pair it with a dedicated uptime checker.
How fast are the alerts? Alerts trigger within minutes of a status change. The exact speed depends on how often the platform checks each service, but it’s generally fast enough to catch issues before your users do.
Can I whitelabel the status page? Yes, you can customize the public status page with your branding and domain if you’re on a paid plan.
What services are supported out of the box? Major providers like AWS, GitHub, Stripe, Google Cloud, Cloudflare, and many more. You can also add custom services if they have public status feeds.
Is there a mobile app? The platform is web-based and works well on mobile browsers. Push notifications depend on your device and browser settings.
AI Developer Tools , AI Analytics Assistant , AI Productivity Tools .
These classifications represent its core capabilities and areas of application. For related tools, explore the linked categories above.
Status Central details
Website unavailable — View Alternatives
Pricing
- Free
Apps
- Web Tools
Categories

Status Central Alternatives Product

XreplyAI

Duct Tape AI…

YouMind

Prelight

Keepmind

LazyLister

Youfiliate

gpt-plus.ai

ModelsLab
