
Lumenn AI
What is Lumenn AI?
Most enterprise analytics tools come with a hidden tax: you need a data team to make them work. Someone has to write the queries, maintain the dashboards, and translate business questions into SQL. It's slow, it's expensive, and it creates a bottleneck that frustrates everyone from the C-suite down to the frontline manager who just wants to know why sales dipped last Tuesday.
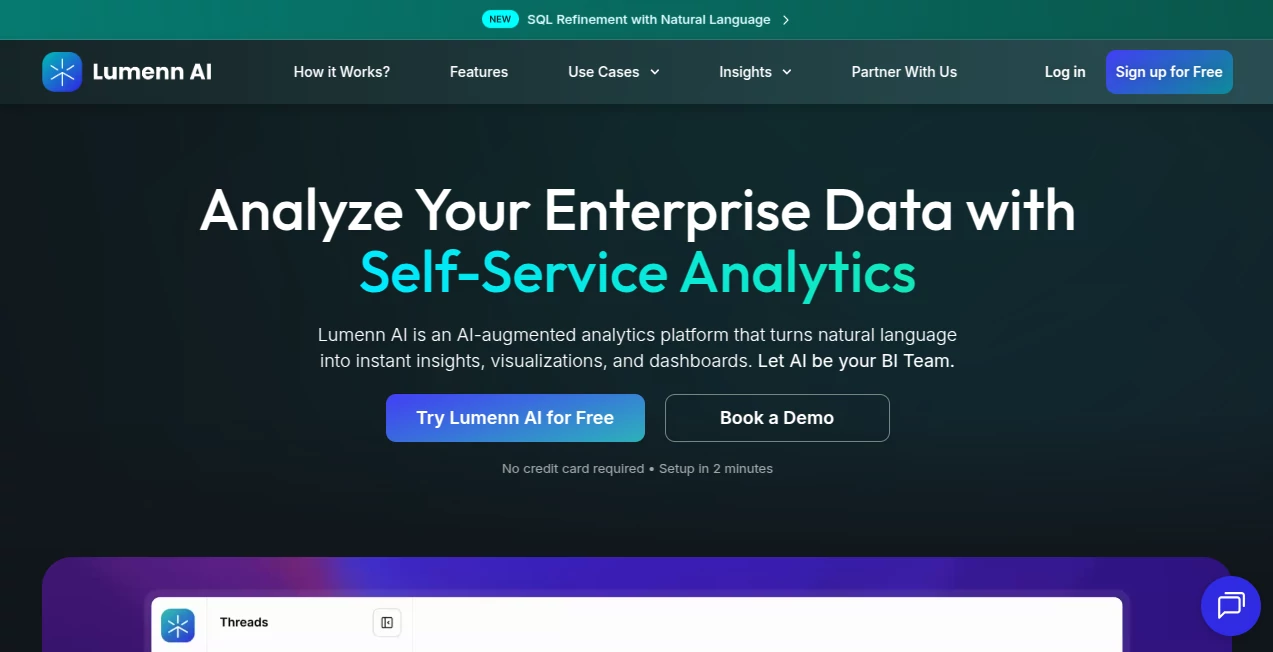
That's the gap this platform was built to close. It's a no-code, AI-augmented analytics solution that lets your entire team — technical or not — connect to enterprise data sources, ask questions in plain English, and get accurate visualizations and dashboards in seconds. No SQL. No waiting on IT. No black-box outputs you can't verify.
Winner of the Best Information Technology & Services Business of the Year 2026 Award by Global 100, the platform has earned trust from data-driven teams across healthcare, banking, retail, manufacturing, and more. The tagline says it plainly: Let AI be your BI team. After spending time with it, that's not a stretch.
Key Features
User Interface
The interface is refreshingly clean. When you log in, you're not greeted by a wall of menus or a complex configuration wizard. The core workflow is three steps: connect your data source, ask a question, get an answer. It genuinely feels that simple.
Dashboards are drag-and-drop, visually polished, and update automatically as your underlying data changes. You can organize analytics into separate Workspaces — a smart touch for teams that manage multiple departments or clients with distinct data boundaries. Everything stays separated without requiring parallel tool setups.
For non-technical users, the natural language query bar is the star of the show. Type something like "show me monthly revenue by region for Q1" and you get a chart. No formatting, no syntax, no guessing. For power users, there's more depth underneath — but the surface stays clean regardless of how deep you go.
Accuracy & Performance
Accuracy in natural language analytics is where most tools stumble. Ambiguous phrasing leads to wrong queries, wrong queries lead to wrong charts, and wrong charts lead to bad decisions. This platform addresses that directly with two standout features.
The first is the Data Dictionary. You upload your organization's specific terminology — metric definitions, business logic, table relationships — and the AI uses that context to interpret questions correctly. It's the difference between a tool that guesses and one that actually understands your business.
The second is Chain of Thought Reasoning. Instead of giving you an answer and asking you to trust it, the system shows you step-by-step how it interpreted your query and applied analytical logic. That transparency is rare and genuinely valuable in enterprise settings where accountability matters.
Performance is also solid. Queries run in-place against live data sources — no data movement, no replication — which means results reflect your actual current data, not a stale copy sitting in some intermediate pipeline.
Capabilities
The feature set goes well beyond basic chart generation. Here's what stands out:
- Natural Language to SQL: Ask questions in plain English and the system generates accurate queries automatically. The SQL Refiner then lets you adjust filters, logic, and time windows using natural language — no rewriting needed.
- Auto Analyst AI Agent: This proactive feature continuously scans your connected datasets and suggests meaningful questions and insights before you think to ask. It's like having an analyst who never sleeps and is always looking for patterns.
- AI-Powered Data Quality: Identifies data issues automatically without requiring manual rule writing, and explains how those issues affect your analytics. Clean data, trustworthy insights.
- Self-Service Dashboards: Build and share interactive dashboards without IT involvement. They stay auto-updated, so your leadership team always sees current numbers.
- Wide Data Source Support: Connects to PostgreSQL, MySQL, Snowflake, Amazon Redshift, Google BigQuery, Azure SQL, AWS S3, Azure Blob Storage, and more — in seconds, using secure read access.
Security & Privacy
Enterprise analytics tools live or die by their security posture, and this platform takes it seriously. Your data never moves. All queries run directly against your connected data sources — nothing is copied, stored, or replicated on third-party servers. That alone eliminates a major category of data exposure risk.
Role-Based Access Control (RBAC) lets you define precisely who can view, query, refine, or manage data, aligned with your organizational hierarchy. For large deployments, SSO (Single Sign-On) is available on the Enterprise plan alongside advanced security and compliance features. On-premises deployment is also an option for organizations with strict data residency requirements.
It's the kind of security architecture you'd want to present to a compliance officer without flinching.
Use Cases
This tool isn't built for one industry — it's designed for the messy, multi-system reality of enterprise data across sectors. Here's where it shines in practice:
- Healthcare: Analyze patient outcomes, claims processing times, staff performance, and billing anomalies without waiting on IT. Identify cost leakages and keep regulatory reporting accurate in real time.
- Banking & Fintech: Explore transaction patterns, customer behavior, and risk metrics using conversational queries. Automate financial reporting and detect compliance anomalies across core systems and data warehouses.
- Manufacturing & Supply Chain: Get full visibility into shop floor operations, downtime trends, supplier performance, and inventory levels by unifying MES, ERP, and quality systems into one interface.
- Retail: Analyze SKU performance, customer churn, regional trends, and campaign ROI in plain English — whether you're managing online orders or in-store traffic.
- Life Sciences & Pharma: Quickly explore clinical trial data, batch quality, and regulatory deviations across global plants to support faster, data-driven R&D decisions.
- Energy & Utilities: Analyze grid load trends, equipment performance, outage patterns, and emissions compliance from SCADA, asset management, and billing systems — and keep audit-ready environmental reports always current.
Beyond industries, the platform serves distinct user types within an organization. Business users get instant answers without technical skills. Data analysts can guide and validate insights using context and interactive SQL. Data teams can dramatically reduce ad-hoc requests and cut BI costs by centralizing analytics in one governed environment.
Pros and Cons
- Pro: Truly no-code — non-technical users can get real answers from real enterprise data without help from IT or analysts.
- Pro: In-place querying means your data never leaves your environment, which is a genuine differentiator for security-conscious enterprises.
- Pro: Chain of Thought Reasoning makes AI-generated insights auditable and explainable — not a black box.
- Pro: The Auto Analyst agent proactively surfaces insights, so you're not always starting from a blank search bar.
- Pro: Broad data source support covers most major enterprise databases and cloud warehouses out of the box.
- Pro: Pricing is transparent and tiered — there's a plan for small teams and a custom option for enterprise-scale deployments.
- Con: The free trial is limited to 15 days, 1 user, and 20 queries per day — enough to evaluate, but not deeply test at scale.
- Con: The Starter plan begins at $299/month billed annually, which may be a stretch for very early-stage startups or individual analysts.
- Con: Advanced features like AI-powered Data Quality are only available from the Growth plan upward.
Pricing Plans
Pricing is straightforward and tiered to match team size and analytics maturity:
- Free Trial: Free for 15 days. Includes 1 user, 2 data sources (up to 2 tables each), 1 workspace, 1 dashboard, and up to 20 queries per day. No credit card required, setup in 2 minutes.
- Starter Pack: $299/month, billed annually. Up to 5 users, 3 data sources, 1 workspace, 3 dashboards, queries up to 200,000 records, and email support. Hosted on a dedicated SaaS cloud tenant.
- Growth Plan: $599/month, billed annually. Up to 10 users, 5 data sources, 3 workspaces, 7 dashboards, queries up to 1 million records, AI-powered Data Quality, and priority email & phone support.
- Enterprise Plan: Custom pricing. Unlimited users, custom data sources and dashboards, SSO, advanced security and compliance features, on-premises deployment option, and a dedicated support manager.
Each paid plan runs on a dedicated cloud tenant — not a shared environment — which matters for performance and data isolation at enterprise scale.
How to Use This Tool
Getting started is deliberately frictionless. Here's the general flow:
- Step 1 – Sign Up: Create a free account through the web portal. No credit card needed. The onboarding takes about 2 minutes.
- Step 2 – Connect Your Data Source: Choose from supported databases and cloud storage systems (Snowflake, BigQuery, PostgreSQL, Redshift, Azure SQL, S3, and more). Connect using secure read access — your data stays in place.
- Step 3 – Upload Your Data Dictionary (Optional but Recommended): Add your organization's business terminology, metric definitions, and table relationships. This step significantly improves query accuracy and reduces misinterpretation.
- Step 4 – Ask Questions: Type your question in plain English in the query bar. The AI generates the SQL, runs it against your data, and returns a chart or table instantly.
- Step 5 – Refine with SQL Refiner: If you want to adjust filters or logic, use the SQL Refiner to modify the generated query using natural language — no rewriting needed.
- Step 6 – Build Dashboards: Add insights to a dashboard with a single click. Organize by workspace, share with your team, and let the auto-update handle the rest.
The whole process from signup to first insight can realistically happen in under 10 minutes. That's not marketing copy — the platform is built specifically to eliminate setup friction.
Comparison with Similar Tools
The enterprise analytics space has a few established players, and it's worth understanding where this tool sits relative to them.
Traditional BI tools like Tableau or Power BI are powerful, but they require technical expertise to configure, maintain, and operate. They're built for data teams, not business users. You still need an analyst to build the dashboard before a VP can read it.
Tools like ThoughtSpot introduced natural language querying to enterprise analytics early on, but typically come with significant implementation complexity and price tags that favor Fortune 500 budgets. They're genuinely enterprise tools — not always accessible to mid-market teams.
What separates this platform is the combination of true no-code accessibility, in-place querying (no data movement), proactive AI insights via the Auto Analyst agent, and transparent reasoning via Chain of Thought. Most tools offer one or two of these things. Getting all four in a single platform with clear, tiered pricing is the real differentiator. For growing teams that want enterprise-grade analytics without enterprise-grade implementation headaches, the value proposition is difficult to argue with.
Conclusion
The promise of "democratized data" has been thrown around the analytics industry for a decade. Most tools that made that promise still required a SQL developer within arm's reach. This platform is one of the few that actually delivers on it.
Between the natural language interface, the in-place querying architecture, the Data Dictionary for business context, Chain of Thought for explainability, and the Auto Analyst agent for proactive insights — it covers the full lifecycle of enterprise analytics in a way that genuinely serves everyone from the data engineer to the sales director who's never touched a database.
If your team is spending more time waiting for reports than acting on them, this is worth a serious look. The free trial requires no credit card and takes minutes to set up. There's very little reason not to try it.
Frequently Asked Questions (FAQ)
What is this platform and how does it work?
It's a no-code, AI-powered enterprise analytics platform. You connect your data sources, ask questions in plain English, and the system generates accurate charts, insights, and dashboards automatically — no SQL or technical skills needed.
Which data sources does it support?
It connects to PostgreSQL, MySQL, Snowflake, Amazon Redshift, Google BigQuery, Azure SQL, AWS S3, Azure Blob Storage, and more — all within seconds using secure read access.
Is my data secure?
Yes. The platform uses in-place querying, meaning your data is never copied, moved, or stored externally. All queries run directly against your connected data sources within your own environment.
Do I need technical skills to use it?
No. The platform is explicitly designed for non-technical users. Natural language queries replace SQL entirely. Technical users can go deeper with the SQL Refiner, but it's not required.
What's the difference between the Growth and Starter plans?
The Growth plan adds AI-powered Data Quality, supports up to 10 users and 5 data sources, allows queries up to 1 million records, and includes priority support. The Starter plan is a lighter option for smaller teams just getting started.
Can the platform be deployed on-premises?
Yes, on-premises deployment is available under the Enterprise plan, alongside custom integrations, SSO, and dedicated support.
What is the Auto Analyst feature?
Auto Analyst is an AI agent that proactively scans your connected datasets and suggests meaningful questions and insights before you ask. It helps teams surface opportunities and anomalies they might otherwise miss.
How does Chain of Thought Reasoning help?
It makes the AI's analytical process transparent by showing step-by-step how your query was interpreted and how the insights were derived. This builds trust and accountability in AI-generated outputs — especially important in regulated industries.
AI No-Code & Low-Code , AI Data Mining , AI Research Tool , AI Analytics Assistant .
These classifications represent its core capabilities and areas of application. For related tools, explore the linked categories above.

Lumenn AI Alternatives Product

Yorph AI

Website Traf…

Verne

Candidate Sc…

PromptZerk

RankPeak

Emergent

Customer Fee…

Vibebot.gg